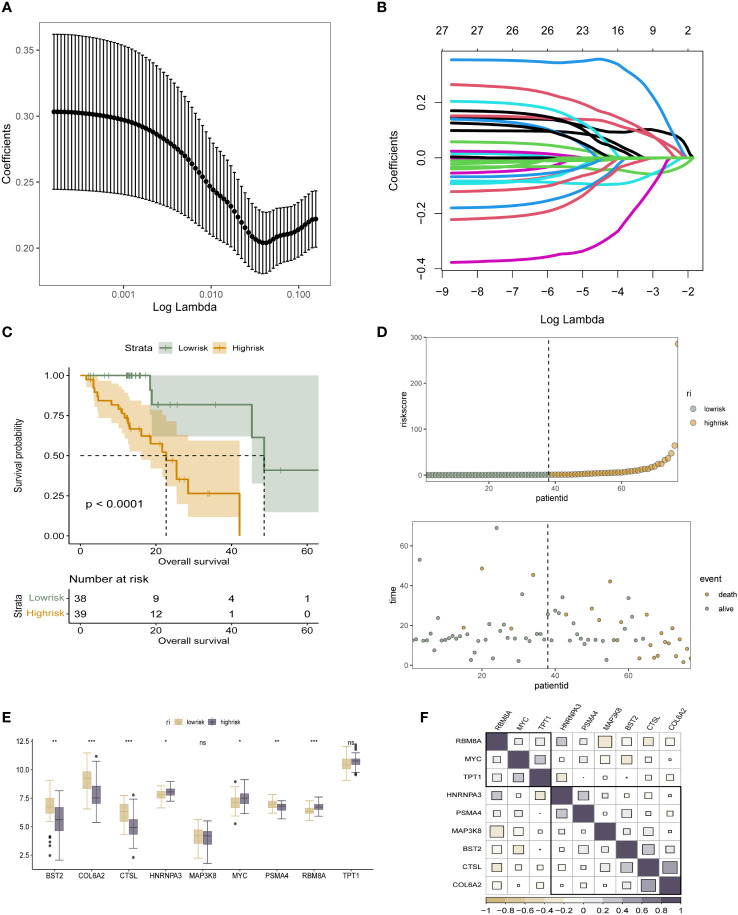
Figure 3.
Acquisition of survival-associated differential genes for m6A epigenetic inheritance and prognostic model construction (A, B). LASSO regression process for screening survival-related prognostic genes from 29 m6A epigenetically related differential genes; (C). K-M analysis reveals the prognostic stratification ability of the constructed m6A epigenetically related riskscore for patients in the high-risk and low-risk groups, respectively; (D). Dotted line and scatter plots reveal the different riskscore of survival time and survival status of ESCC patients, from left to right representing the high and low variation of riskscore, respectively, and scatter colours representing survival and death status; (E). Box line plot revealing the expression distribution of 10 risk genes in the low- and high-risk groups of the 6A epigenetic patient population; (F). Expression correlation plot of the 10 risk genes constituting the riskscore. * means <0.05, ** means <0.01, *** means <0.001, ns means >0.05.

