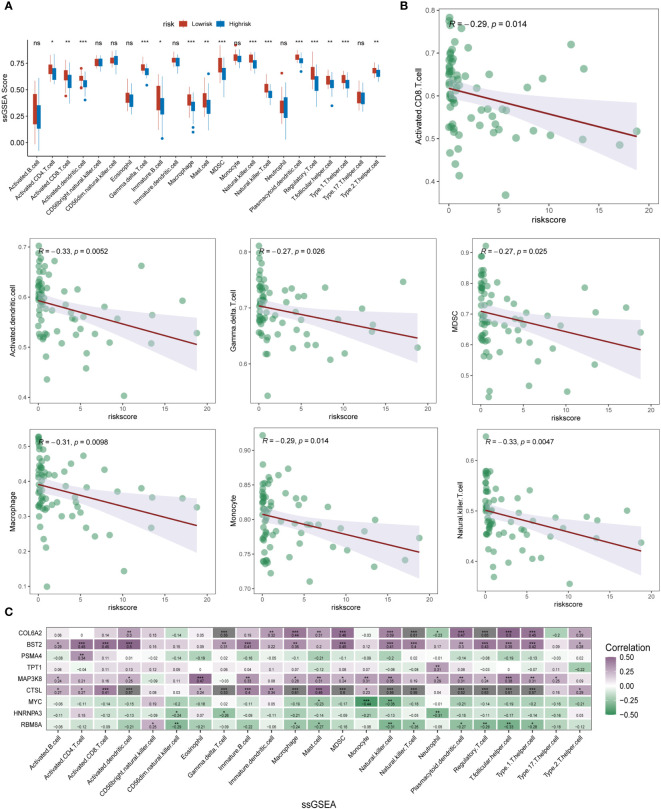
Figure 5.
ssGSEA analysis of immune infiltration and cell expression annotation in ESCC patients. (A) Box plot format analyzing the differential expression of multiple immune cells and immune-related proteins in the m6A high-risk and low-risk groups. The expression of several types of immune cells, including activated CD8 T cells, MDSC, gama delta T cells, activated dendritic cells, NK T cells, macrophages, and Monocyte, differed significantly between subgroups, and the m6A epistasis The expression levels of these immune cell types were significantly higher in the low-risk group than in the high-risk group; (B) Linear correlation plots assessed the expression correlations between multiple immune cell types and the riskscore; (C) Correlational heat map analysis further clarified the correlation between multiple immune cells and immune infiltration levels and the expression of each specific gene in the m6A risk model (shades of colour indicate the level of correlation, purple indicates positive correlation, blue indicates negative correlation). * means <0.05, ** means <0.01, *** means <0.001, ns means >0.05.

