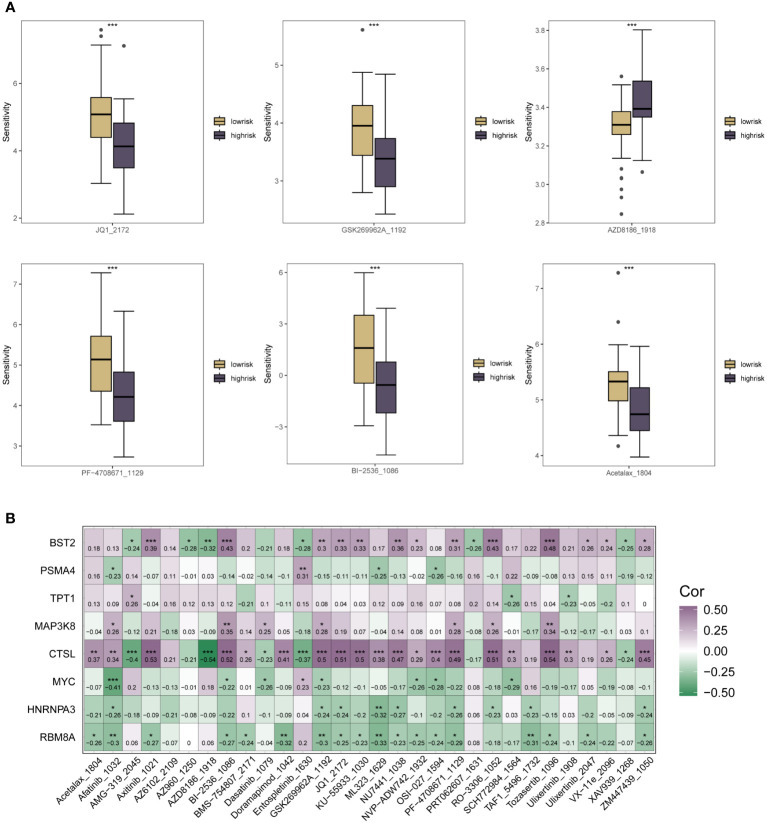
Figure 6.
Correlation analysis of the riskscore expression of m6A in ESCC patients with the sensitivity scores of drugs in the GDSC database. (A) Box plots of specific expression associations between treatment sensitivity and riskscore groupings for multiple oncology therapies. Chemotherapeutic agents include AZD8186_1918, SK269962A_1192, Acetalax_1804, Bl-2536_1086, JQ1_2172, PF-4708671_1129; (B) Correlation heat map analysis further clarifies the therapeutic sensitivity of multiple chemotherapeutic agents with specific each gene in the m6A risk model for expression correlation. * means <0.05, ** means <0.01, *** means <0.001.

