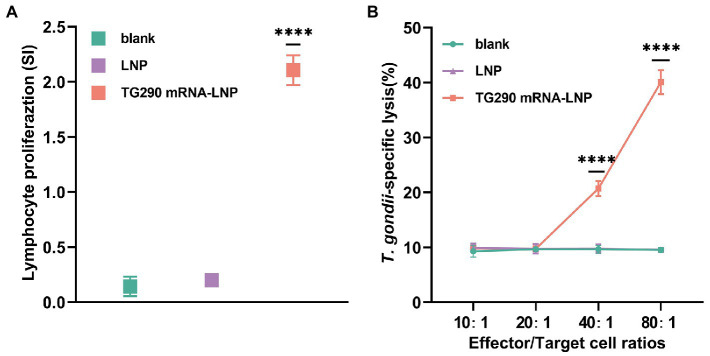
Figure 5.
Proliferation and CTL activity of lymphocytes in immunized BALB/c mice. (A) The proliferative responses of splenocytes in immunized BALB/c mice. SI, stimulation index. (B) CTL activity of spleen lymphocytes in TG290 mRNA-LNP immunized mice. The horizontal axis indicates the effector-to-target cell ratios. The vertical axis shows the percentage of T. gondii-specific lysis. Data were obtained from triplicate independent experiments and are presented as means ± SD (n = 5). ****p < 0.0001, analyzed by One-way ANOVA with multiple comparisons (compare the mean of each group with the mean of every other group).

