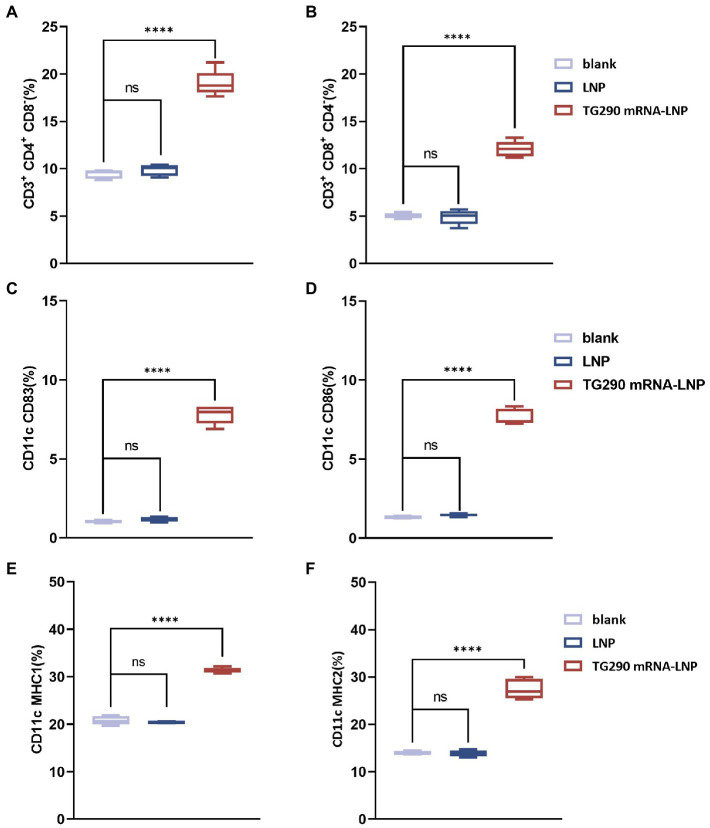
Figure 6.
Flow cytometry analysis. The percentage of CD4+ (A) and CD8+ T lymphocytes (B) in splenic lymphocytes. The percentage of CD83 (C) and CD86 molecules (D) on splenic DCs. The percentage of MHC-I (E) and MHC-II molecules (F) on splenic DCs. n = 5; ****p < 0.0001, analyzed by One-way ANOVA with multiple comparisons (compare the mean of each group with the mean of every other group).

