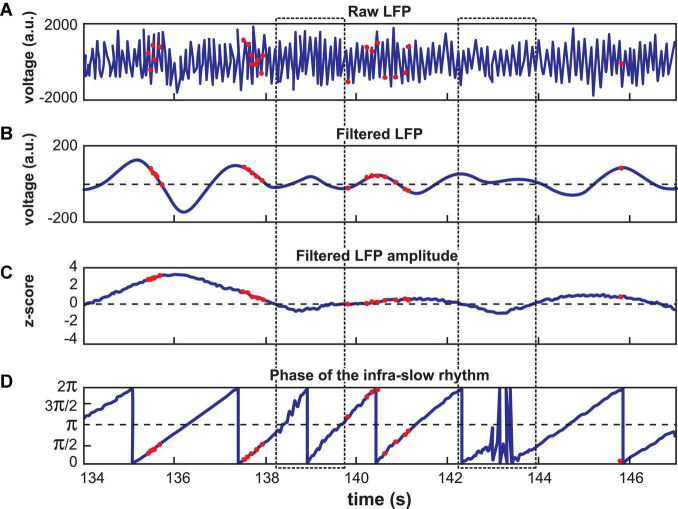
FIGURE 1.
Calculation of LC spike phase relative to Hip or Pfc LFP. (A) Unfiltered signal of a hippocampal recording, with theta oscillations dominating. (B) The signal from (A) band-pass filtered at 0.1–1.0 Hz. Red dots indicate LC neuron action potentials in all panels. (C) The amplitude of the signal in (B) was z-scored. Low amplitude oscillations were excluded from analyses according to a selected criterion of z ≤ 0 (excluded zones are demarcated by the dotted rectangles). (D) Phase of the filtered signal in (B). Note that the LC spikes generally occur at phases between 0 and π/2 radians in this example. The jagged traces near 138.5 and 143 s correspond to excluded data, where phase could not be computed reliably.

