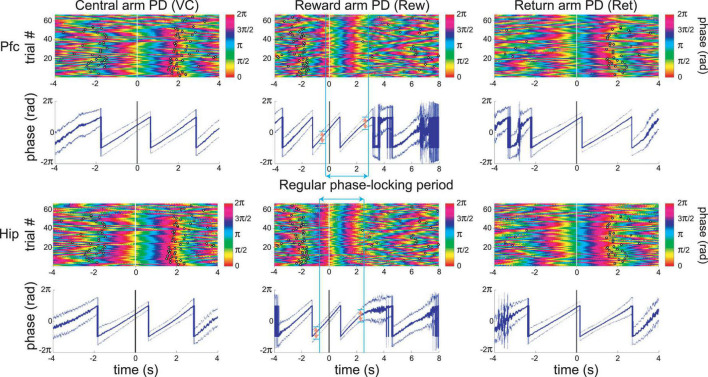
FIGURE 4.
An example of simultaneous recordings of Pfc and Hip LFP infra-slow oscillations phase-locked to principal maze events, the PD crossings (at time zero). Each row of the color plots corresponds to a single trial. The phase of the infra-slow LFP is color-coded. Black rings correspond to the PD crossing prior to (left) or after (right) the event at zero for each plot. Note that the time scales vary among the events, in order to display prior and subsequent PD’s. The dark traces in the 2nd and 4th rows show mean phase while the lighter shaded upper and lower lines are ±SEM. In the middle column, the blue vertical bars and blue double-headed arrow illustrate the calculation of the range of regular phase-locking (defined here as the period with the criterion of SEM range <0.75*π radians; pink double-headed arrows). Here, desynchronization (zones with wider SEM ranges) and discontinuities in the mean phase result from inter-trial variability in speed and distance from the synchronization point (PD–photodetector crossing). This is from the same session as the recording in Figure 3B.

