Figure 3.
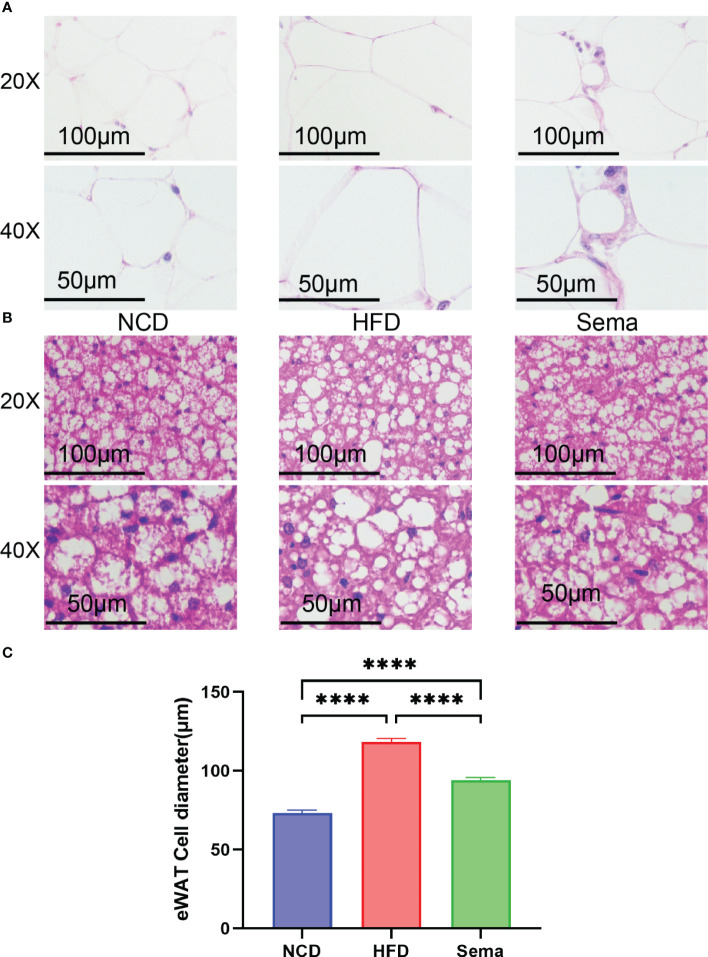
Representative image of histological changes of eWAT and iBAT. The size of adipocyte evaluated by staining with H&E. (A) Representative H&E staining from eWAT of mice. Scale bar, 100 µm, and 50 µm. (n = 3). (B) Representative H&E staining from iBAT of mice. Scale bar, 100 µm, and 50 µm. (n = 3). (C) The fat diameter of the adipocyte was quantified by Image J (n = 5). Statistical results are presented as the mean ± SEM. **** p < 0.0001 is an indicative significance compared with vehicle-treated right-side fat as self-control.

