
Figure 3.
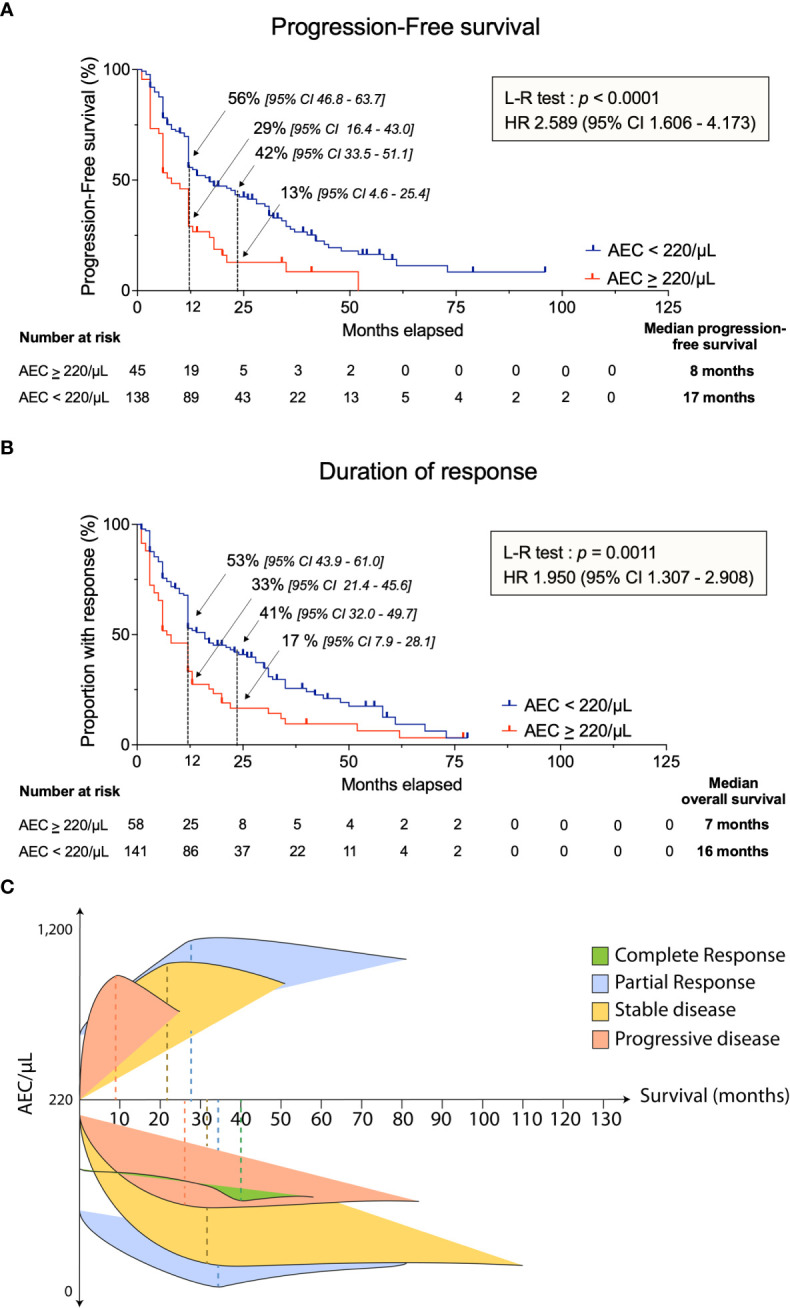
Response to chemotherapy according to AEC cutoff. (A) Progression-free survival in all randomized patients. (B) Duration of response in confirmed responders segregated by the AEC cutoff of 220/µL. (C) Schematic representation of response to chemotherapy, survival distribution and AEC. Dashed lines are the median survival (in months) corresponding to the type of response. L-R test, Log-Rank test; HR, hazard ratio; AEC, absolute eosinophil count.