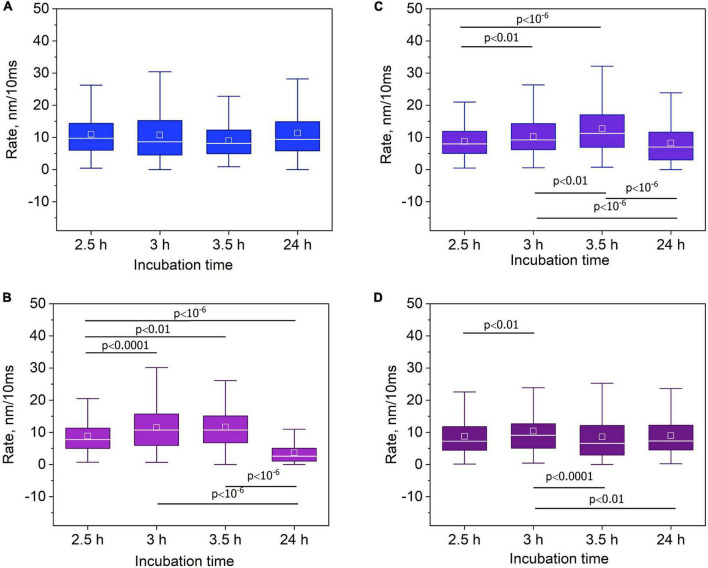
FIGURE 3.
The effect of X-ray irradiation and antifungal drug treatment on the nanomotion rate of Candida albicans. The absorbed dose was 600 Gy, the concentration of FLC was 1000 mg/L. (A) The absence of significant changes in the nanomotion rate for the control cell sample (non-irradiated and untreated) (Multiple comparison (Dunn’s test) post-hoc analysis with Bonferroni’s correction: p > 0.008333). (B) Time-dependent behavior of the nanomotion rate for the irradiated cell samples. ANOVA by ranks test (p < 10– 6); multiple comparison (Dunn’s test) post-hoc analysis. (C) Time-dependent behavior of the nanomotion rate for the FLC-treated cell samples. ANOVA by ranks test (p < 10– 6); multiple comparison (Dunn’s test) post-hoc analysis. (D) Time-dependent behavior of the nanomotion rate for the FLC-treated and irradiated cell samples. ANOVA by ranks test (p = 0.006913); multiple comparison (Dunn’s test) post-hoc analysis. Data are represented as median (line), mean (square), IQR (box), and 1.5 IQR (whiskers).

