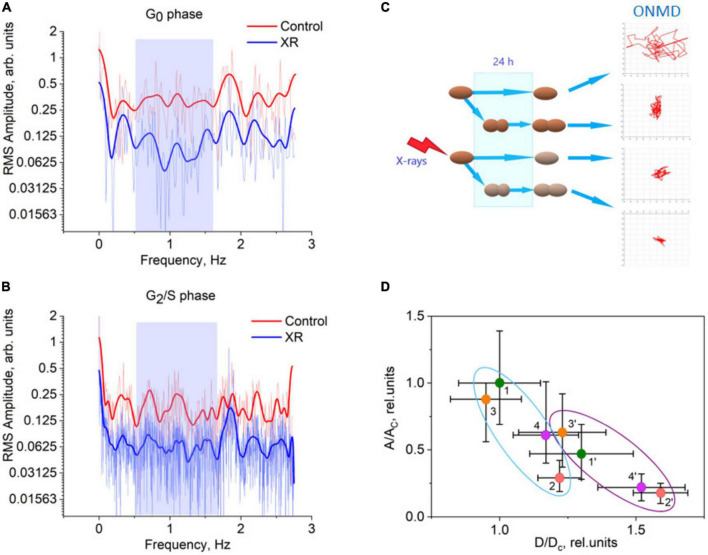
FIGURE 4.
Spectral analysis of Candida albicans nanomotion rate at 24 h incubation time after experiment start. (A,B) Fourier transform spectrum for the RMS amplitude of the nanomotion rate. G0-phase yeast cells (A) S/G2-phase yeast cells (B). The blue rectangle in the figures shows the frequency range of 0.55–1.60 Hz that lies between two Fourier spectrum peaks that is characteristic for all the C. albicans samples studied (about 0.3 and 1.9 Hz). Pale curves represent experimental data, bright colored curves represent the results of the curve smoothing by the FFT filter method. (C) The scheme of the analysis of cell nanomotion data for control (non-irradiated and untreated) and X-ray irradiated cultures. (D) The relative RMS amplitude of cell nanomotion rate averaged over the frequency range of 0.55–1.60 Hz against the relative averaged cell diameter for C. albicans after their exposure to various factors. Relative RMS amplitude was calculated with respect to the median RMS amplitude of the control yeast culture. A is the RMS amplitude of the studied sample, Ac is the RMS amplitude of the control (non-irradiated and untreated) sample. Relative cell diameter was assessed using light microscopy images and ImageJ software and calculated with respect to the median cell diameter of the control yeast culture. D is the cell diameter in the studied C. albicans sample, Dc is the cell diameter of the control C. albicans culture. The diameter of cells normally having spheroidal shape was assessed as the average of their maximal and minimal sizes. The diameter of budding cells having the shape of two linked together spheroids is roughly approximated as the diameter of spheroidal cell times 1.3. The cell samples were marked using the following numbers and colors: control (1, 1′, green circles), X-ray irradiated (2, 2′, scarlet circles), FLC-treated (3, 3′, orange circles) and FLC-treated and X-ray irradiated (4, 4′, lilac circles), where 1, 2, 3, and 4 (included into light blue oval) represent the data for G0-phase cells, 1′, 2′, 3′, and 4′ (included into violet oval) represent the data for G2/S-phase cells.

