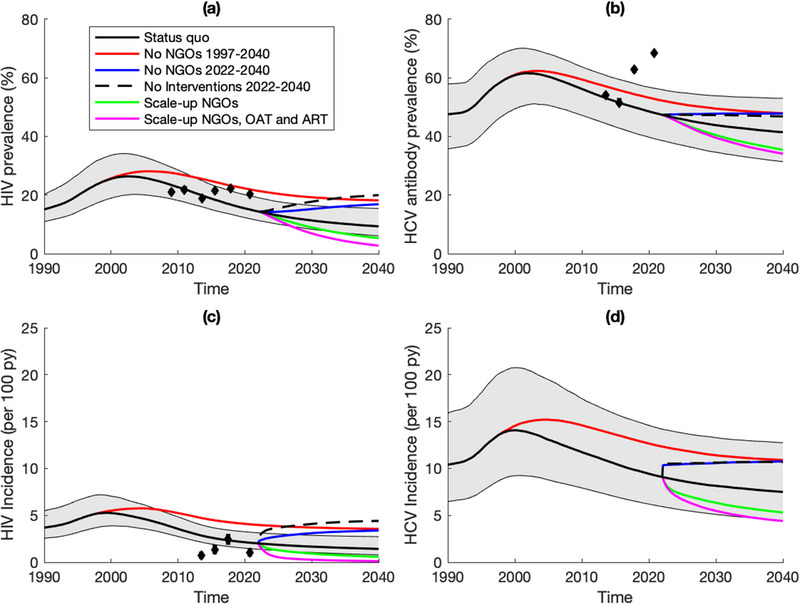
Figure 2.

Model projections of (a) HIV prevalence, (b) HCV antibody prevalence, (c) HIV incidence and (d) HCV incidence. Notes: Solid black lines and grey shaded area show the median and 95% credibility interval of the baseline model fits with existing coverage levels of non‐governmental organizations (NGOs) continuing past 2022. Coloured lines show median model projections: without NGOs since 1997 (red); without NGOs from 2022 (blue); without NGOs, opioid agonist treatment (OAT) or antiretroviral therapy (ART) from 2022 (black dashed); with scaled‐up NGO coverage (60%) from 2022 (green); with scaled‐up NGO (60%) as well as OAT (20%) and ART (81%) coverages from 2022 (magenta). Data points with whiskers show data and their 95% confidence intervals with all datapoints based on community recruited people who inject drugs that were not used in model calibration.
