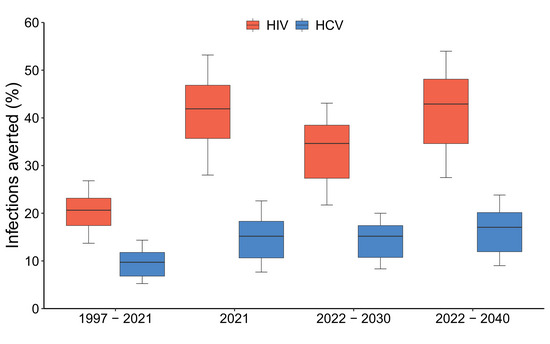
Figure 3.

Proportion of new HIV and HCV infections averted among PWID by non‐governmental organizations (NGOs). Notes: Figure shows the impact NGOs have had since NGOs started (1997) and in the last year (2021) and the projected impact over 2022–2030 and 2022–2040. All are compared to no NGOs in past or future depending on the scenario. Boxes indicate the interquartile range, with the lines inside indicating the median impact, with whiskers representing 95% credibility intervals for the simulations.
