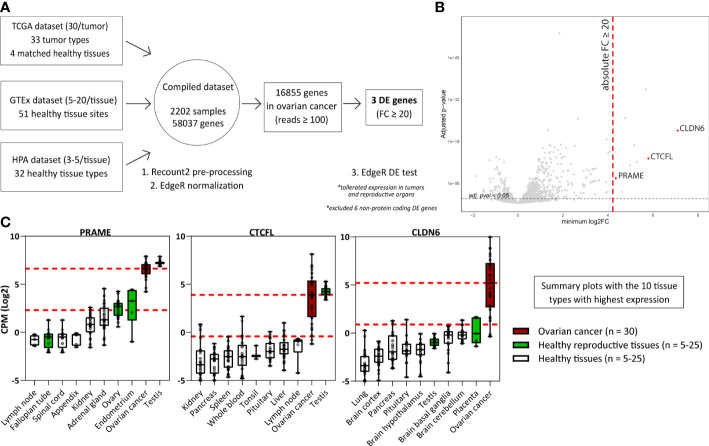
Figure 1.
Differential gene expression analysis reveals genes associated with High-Grade Serous Ovarian Carcinoma. (A) Scheme depicting the differential gene expression analysis strategy. (B) Plot displaying for all genes the minimum FC against the adj. p-val. Indicated in red are the three identified DE genes (FC ≥ 20; adj. p-val ≤ 0.05). Indicated in grey are non-DE genes and non-protein coding genes. (C) Boxplots depicting PRAME, CTCFL and CLDN6 expression in ovarian cancer (TCGA data, n = 30) and the 9 healthy tissue types with highest gene expression (HPA and/or GTEx data, n = 5-25). Overlapping healthy tissue types within the HPA and GTEx were combined when possible. Boxplots extend from first to third quartile, the horizontal line represent the median expression value. The whiskers represent minimum and maximum expression. The upper and lower red dashed lines represent the median expression value and the 20 times lower expression value, respectively. (Adj. p-val: false discovery rate adjusted p-value, DE, differentially expressed; FC, fold change; GTEx, genotype-tissue expression; HPA, human protein atlas; CPM Log2, log2-transformed counts per million; minimum log2FC, log2 fold change; TCGA, The cancer genome atlas).

