Figure 6.
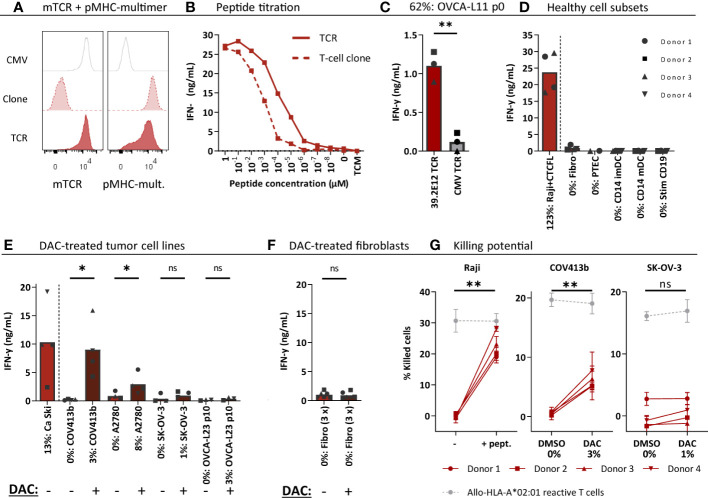
CTCFL TCR-T cells recognize and kill (DAC-treated) CTCFL positive OVCA cells. CD8+ cells of four different donors were retrovirally transduced to express the 39.2E12CTCFL/KLH/A2 TCR and purified. (A) Representative flow cytometry plots of purified CMV and CTCFL TCR-T cells, and the parental CTCFL T-cell clone stained with murine TCR (mTCR) and the CTCFL-specific pMHC-mult. (B) IFN-γ production (ng/mL) of the TCR-T cells and parental T-cell clone cocultured overnight with Raji cells transduced with HLA-A*02:01 and loaded with titrated peptide concentrations (E:T = 1:6). (C–F) IFN-γ production of TCR-T cells cocultured with (C) single viable cells of primary patient-derived sample OVCA-L11 passage 0 (E:T 1:6), (D) healthy cell subsets of multiple donors (E:T = 1:4 for fibroblasts, PTECs and CD14+, and 1:6 for CD19+), (E) 7 days 1 µM DAC or DMSO treated tumor cells (E:T = 1:6), and (F) 7 days 1 µM DAC or DMSO treated fibroblasts. Bars represent mean and symbols depict averaged duplicate values from three or four different donors tested in two independent experiments. (G) Cytotoxic capacity of CTCFL TCR-T cells in a 6-hour 51Cr-release assay against Raji cells loaded with the KLH peptide, and COV413b and SK-OV-3 treated with 7 days 1 µM DAC or DMSO. Mean and SD depict technical triplicates from four different donors tested in two independent experiments, at E:T ratio 10:1. Cytotoxic capacity of an allo-HLA-A*02:01 reactive T-cell clone recognizing HKG USP11 is shown for the different conditions (41). (B–G) All target cells express HLA-A*02:01, either wildtype or the HLA allele was introduced by transduction (Raji, SK-OV-3, A2780). Percentage relative CTCFL (TvX) expression is depicted, as determined by qPCR. (D) IFN-γ production of CTCFL TCR- and CMV TCR-T cells compared using a paired t-test (two-sided). (E–G) IFN-γ production and cytotoxicity of CTCFL TCR-T cells cocultured with DMSO and DAC-treated cells, or Raji cells loaded with and without peptide, compared using a paired t-test (two-sided). (ns, not significant; DAC, 5-aza-2′-deoxycytidine; imDCs and mDCs, immature and mature dendritic cells; pMHC-mult, peptide MHC-multimers; PTECs, proximal tubular epithelial cells; OVCA, primary ovarian carcinoma sample). Meaning of the * are listed in the M&M. Significance levels are indicated as p <.05 *, p <.01 **. ns, not significant.

