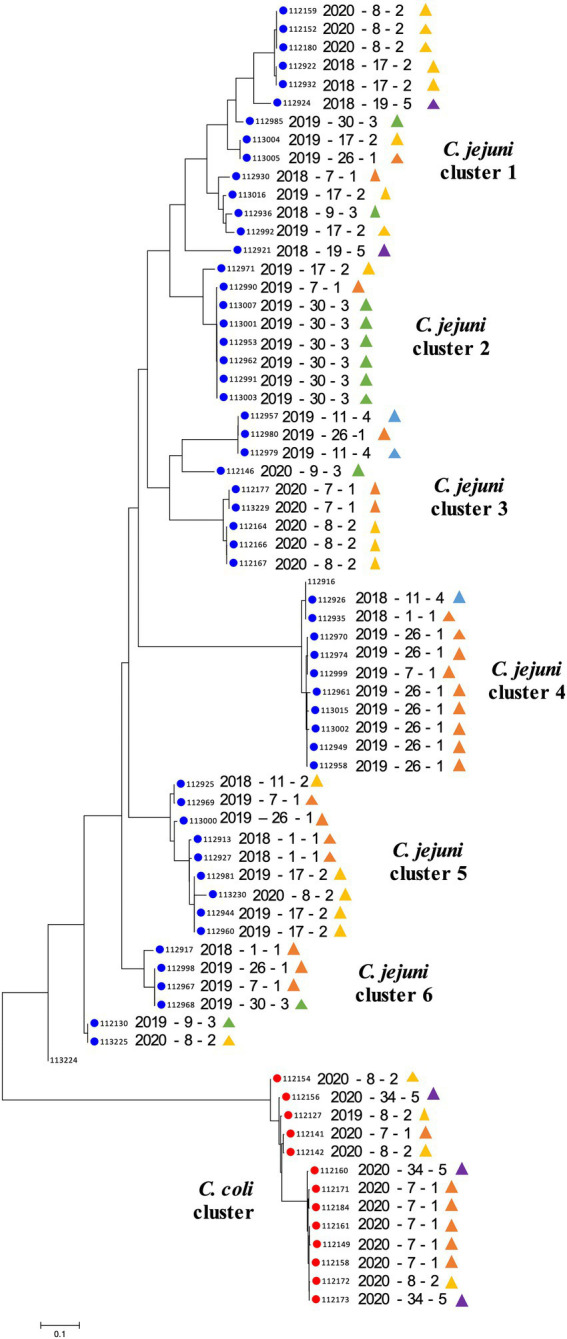
Figure 2.

Phylogenetic diversity based on single nucleotide polymorphisms (SNPs) analysis. The phylogenetic tree was constructed using the Neighbor-Joining method. The optimal tree with the sum of branch length = 2.14 is shown. The tree was generated to scale with branch lengths in the same units as those of the evolutionary distances used to infer the phylogenetic tree. The analysis involved 69 genomes. There was a total of 2,748 positions in the final dataset. The scale bar represents a 0.1 base substitution per site. Each row indicates a specific Campylobacter isolate (year of collection—farm ID—farm cluster). Blue and red circles indicate Campylobacter jejuni and Campylobacter coli, respectively. Colored triangles are associated with the farm cluster number; orange, yellow, green, blue and purple triangles indicate farm clusters 1 to 5, respectively (Figure 1).
