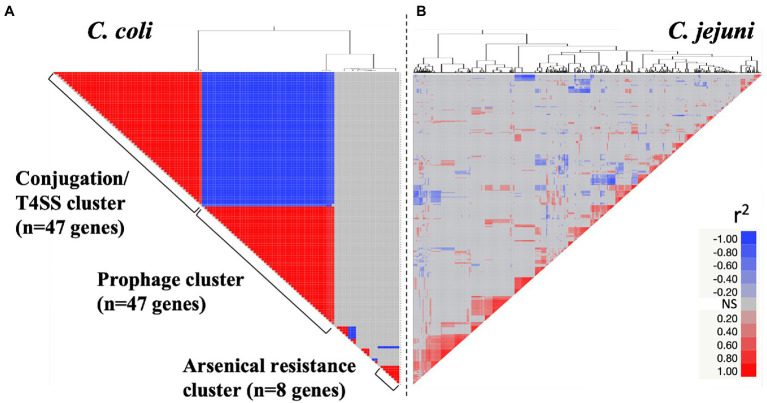
Figure 5.
Co-occurrence of genes from the variable genome for both Campylobacter coli (A; n = 102 genes) and Campylobacter jejuni (B; n = 401 genes). X- and Y-axes display the gene co-occurrence profile (r2 value). Red and blue cells represent positive and negative correlations between genes of the variable genome (P < 0.01), respectively. Gray cells indicate non-significant correlations (NS; P > 0.01). Details about the gene co-occurrence profile for C. coli are displayed in Supplementary Table 8.

