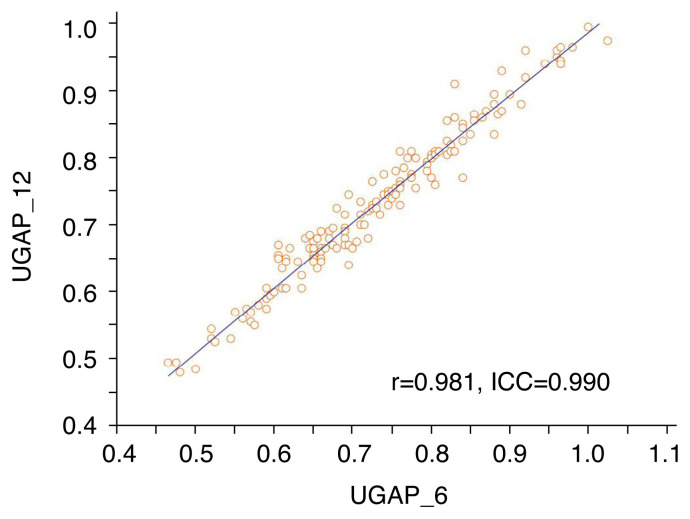
Fig. 4.
Scatterplots between the attenuation coefficient (AC) values obtained using UGAP_6 and UGAP_12.
The Pearson correlation (r) and intra-class correlation coefficient (ICC) are shown in the plot. The scatterplots show an excellent correlation between AC values obtained using UGAP_6 and UGAP_12. UGAP, ultrasound-guided attenuation parameter; UGAP_6, 6-repeated measurements obtaining 6 attenuation coefficients using UGAP; UGAP_12, 12-repeated measurements obtaining 12 attenuation coefficients using UGAP.

