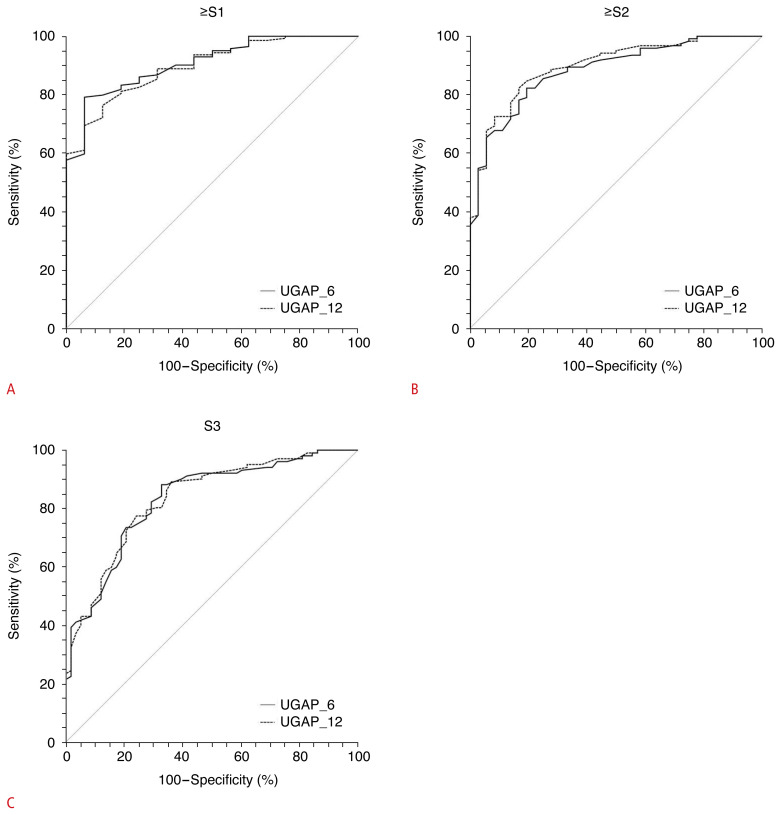
Fig. 6.
Comparison of receiver operating characteristic curves between UGAP_6 and UGAP_12 for diagnosing ≥S1 (A), ≥S2 (B), and S3 (C).
UGAP, ultrasound-guided attenuation parameter; UGAP_6, 6-repeated measurements obtaining 6 attenuation coefficients using UGAP; UGAP_12, 12-repeated measurements obtaining 12 attenuation coefficients using UGAP.

