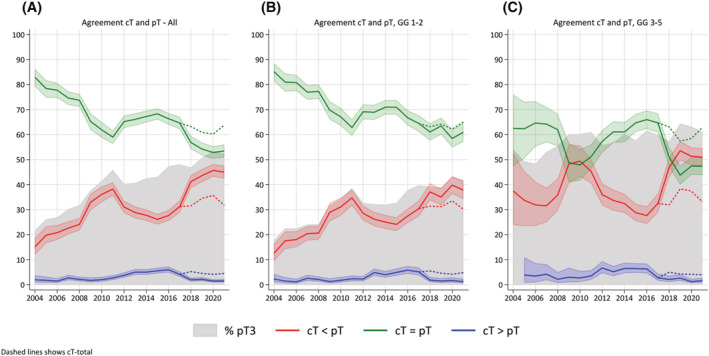
FIGURE 2.

(A) Agreement of reported clinical T‐stage (cT‐stage) and pT after radical prostatectomy in Norway from 2004 (n = 272) to 2021 (n = 1792). From 2017, the reported cT‐stage is based on DRE only (cT‐DRE) (continuous lines). Dashed lines from 2017 represents cT‐stage based on DRE and MRI (cT‐Total). (B) Same as (A) but for ISUP grade groups (GGs) 1 and 2. (C) Same as (A) but for ISUP GG ≥3
