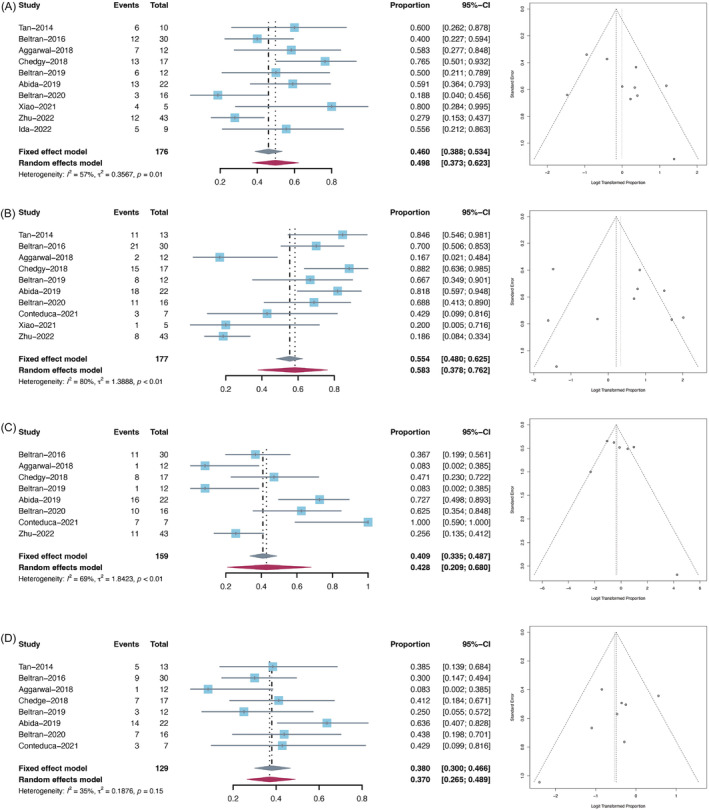
FIGURE 2.

Forest plots (left) and funnel plots (right) of frequent mutations and copy number alterations in NEPC. (A) Pooled prevalence of TP53 mutations; (B) pooled prevalence of RB1 loss; (C) pooled prevalence of TP53 loss; (D) pooled prevalence of PTEN loss
