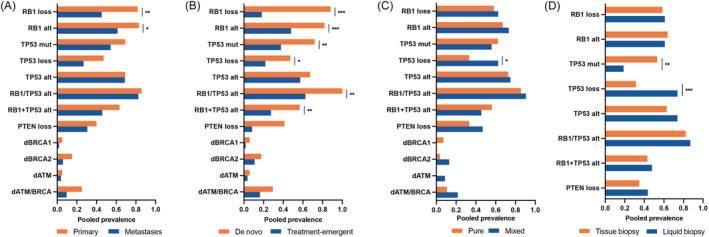
FIGURE 3.

Pooled prevalence of selected genomic alterations comparing (A) primary tumours and metastases; (B) de novo NEPC and treatment‐emergent NEPC; (C) pure NEPC and mixed NEPC; and (D) liquid biopsy and tissue biopsy. *p < 0.05; **p < 0.01; ***p < 0.001
