Figure 3.
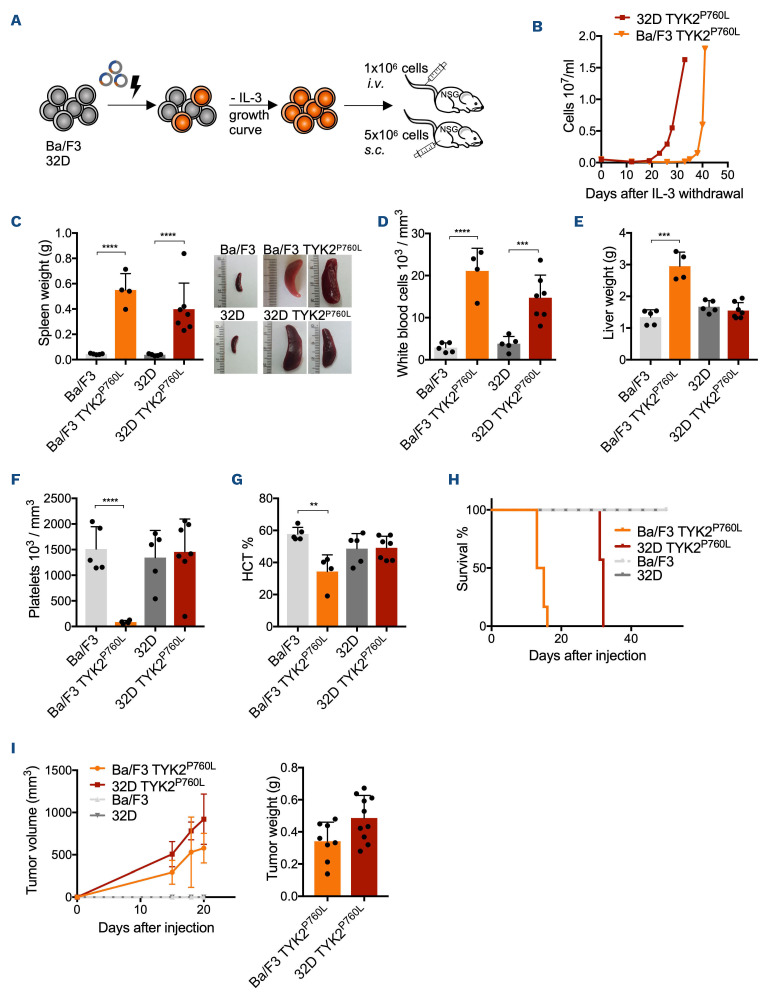
In vitro and in vivo transformation capacity of TYK2 mutants. (A) Schematic outline of the Ba/F3 and 32D cell experiment: cells were electroporated with the different TYK2 constructs (Figure 1A), IL-3 was withdrawn, and outgrowth was monitored. Transformed and parental cells were injected intravenously (i.v.) or subcutaneously (s.c.) into NOD.Cg-PrkdcscidIl2rgtm1Wjl/Sz (NSG) mice. (B) Representative growth curve of Ba/F3 (orange) and 32D cells (red) gaining IL-3 independence by expression of TYK2 P760L (n=3). (C to G) Spleen weight with representative spleen pictures, white blood cell count, liver weight, platelet count and hematocrit (HCT) of i.v. injected mice (Ba/F3 and 32D cells: n=5, Ba/F3 TYK2 P760L cells: n=4 (as humane endpoint was set for 2 mice), 32D TYK2 P760L cells: n=7, unpaired two-tailed t-test with log and arcsine square root [HCT] transformed data, from 2 experiments). (H) Kaplan Meier plot of i.v. injected mice (Ba/F3 and 32D cells [grey]: n=5, Ba/F3 TYK2 P760L cells: n=6, 32D TYK2 P760L cells: n=7, log-rank test: P-value =0.0002 between Ba/F3 TYK2 P760L cells and 32D TYK2 P760L cells, from 2 experiments). (I) Tumor growth of s.c. injected cells into right and left flank (Ba/F3 TYK2 P760L cells: n=5 [individual tumors, one site without tumor formation], 32D TYK2 P760L cells: n=6 [individual tumors]) and individual tumor weight (Ba/F3 TYK2 P760L cells: n=8 [2 sites without tumor formation], 32D TYK2 P760L cells: n=10, from 2 experiments). **P<0.01, ***P<0.001, ****P<0.0001.

