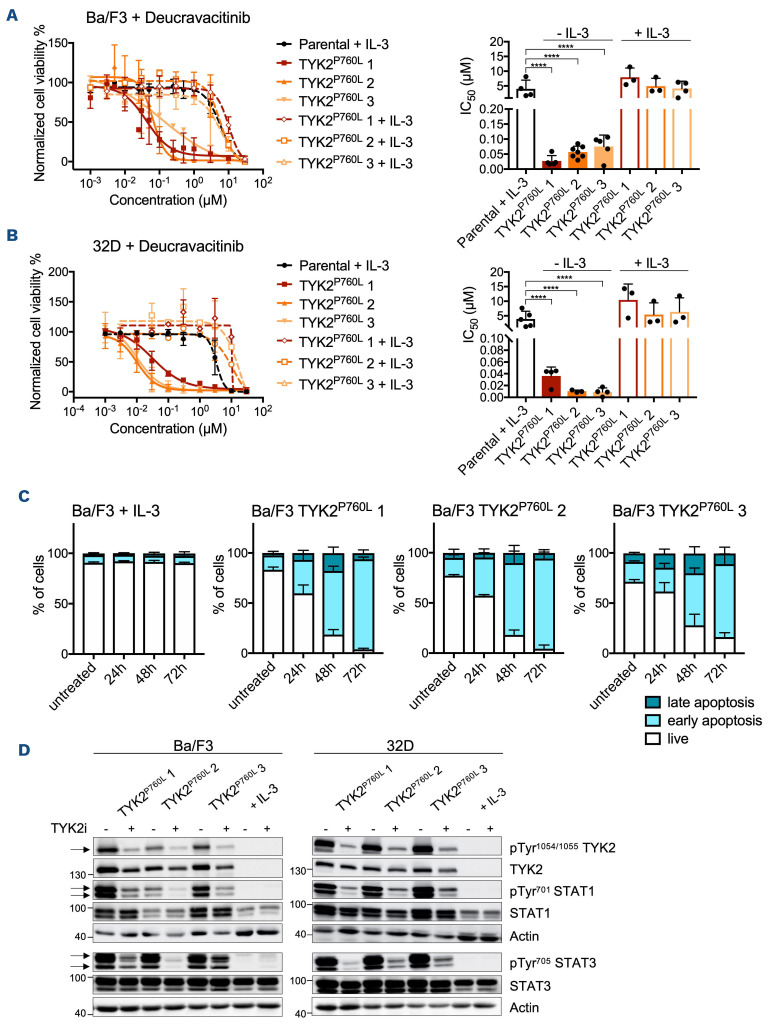
Figure 4.
Viability of TYK2 P760L-transformed hematopoietic cell lines upon TYK2 inhibition and effect on signaling to STAT. (A and B) Dose response curves and half maximal inhibitory concentration (IC50) values of parental (black) and transformed Ba/F3 and 32D cells (shades of red) treated with deucravacitinib (TYK2inib) for 72 hours (h) supplemented with (dashed line/white filling) and without IL-3 (n≥3, in duplicates or triplicates, not all IC50 could be determined, one-way ANOVA with log transformed data). (C) Analysis of early apoptosis (Annexin V+ and 7-AAD-) and late apoptosis (Annexin V+ and 7-AAD+) of parental and transformed Ba/F3 cells treated with 1 µM deucravacitinib for 24 h, 48 h and 72 h (n=3 in duplicates). (D) Western blot of TYK2 P760L-transformed Ba/F3 and 32D cells and parental cells (with IL-3) subjected to (phospho-) TYK2-STAT1/3 analysis. Cells were treated with 1 µM deucravacitinib (TYK2i) for 6 h. Actin was used as loading control. Numbers indicate molecular weight markers in kDa. ****P<0.0001.

