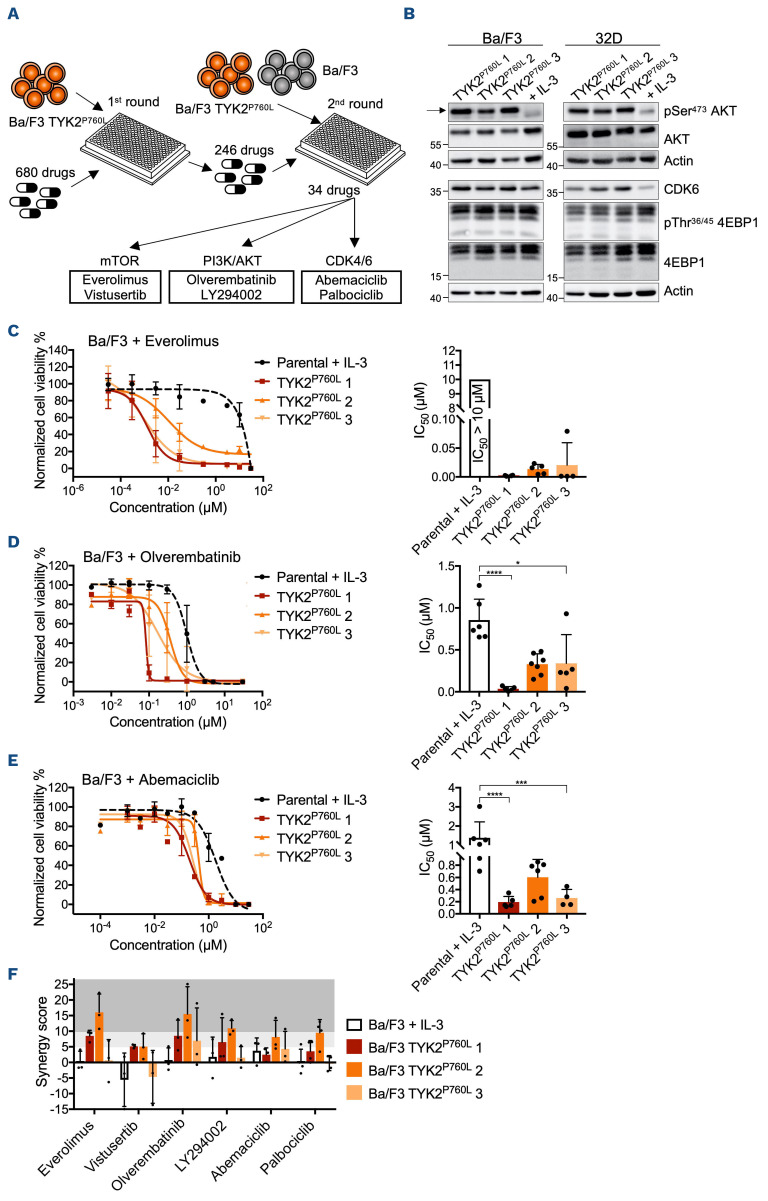
Figure 5.
Drug screen of TYK2 P760L-expressing cells and cross-talk with other kinase-dependent pathways. (A) Schematic outline of drug screen: Ba/F3 TYK2 P760L cells of the first outgrowth experiment were treated with 680 kinase inhibitors in a high throughput screen. In the second round 246 drugs identified (<30% viability of control) were used for comparison of Ba/F3 TYK2 P760L and parental cells. Among the top hits were mainly drugs targeting the mTOR, PI3K/AKT and CDK4/6 pathway. These targets were validated with the indicated drugs. (B) Western blot of TYK2 P760L-transformed Ba/F3 and 32D cells and parental cells (with IL-3) subjected to (phospho-) AKT, 4EBP1 and CDK6 analysis. Actin was used as loading control. Numbers indicate molecular weight markers in kDa. (C to E) Validation of screen result with dose-response curves and half maximal inhibitory concentration (IC50) values of parental (black dashed line/white filling, with IL-3) and transformed Ba/F3 cells (shades of red) treated for 72 hours (n≥3, in duplicates, not all IC50 could be determined, one-way ANOVA with log transformed data). (F) Synergy scores (n≥3, in duplicates) calculated with the zero interaction potency (ZIP) model. Light grey shows additivity, dark grey synergy. *P<0.05, ***P<0.001, ****P<0.0001.

