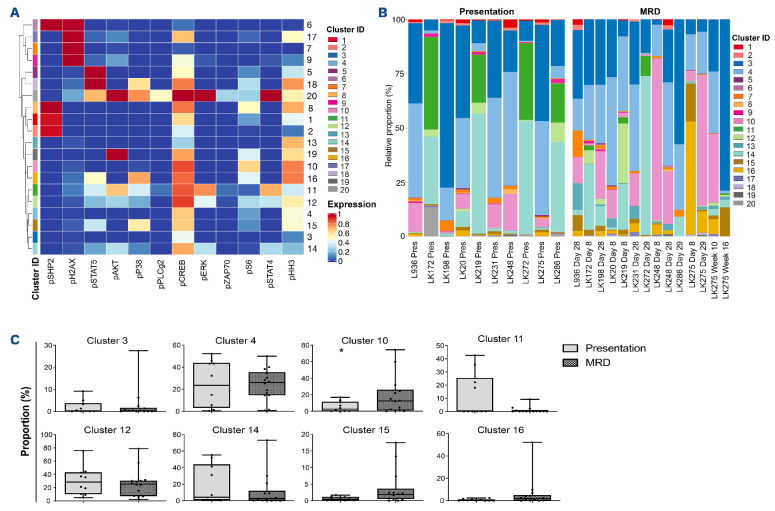
Figure 4.
Cluster analysis revealed that phosphorylation of acute lymphoblastic leukemia cells at presentation (drug-naïve) and during treatment (with minimal residual disease) is complex and heterogeneous with all clusters having activated CREB and a cluster characterized by high levels of pCREB, pHH3 and pS6 having an apparent selective advantage during induction therapy. (A) Heatmap showing expression of target markers within generated clusters, with marker expression intensity displayed from low (blue) to high (red). (B) Bar chart showing whole population cluster composition within patients, separated into presentation and minimal residual disease (MRD) samples. (C) Box plots comparing the incidence of the top eight expressed clusters in the cohort of patients, comparing proportions of presentation and MRD samples of acute lymphoblastic leukemia (ALL) cells in the various clusters. *P<0.05.

