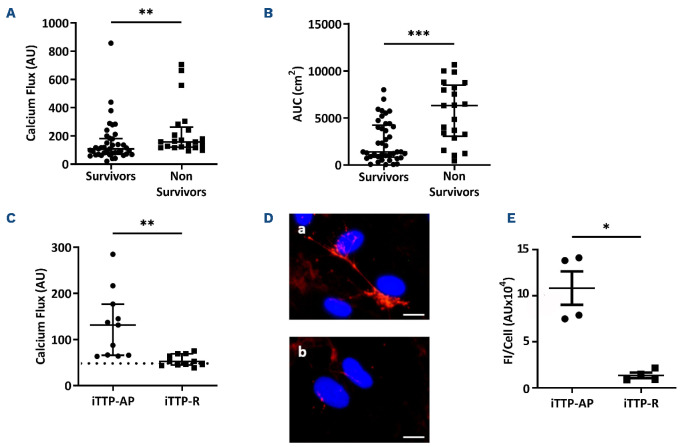
Figure 3.
In vitro endothelial Ca2+ flux intensity induced by immune-mediated thrombotic thrombocytopenic purpura plasma is associated with clinical severity and prognosis. (A) Fluorescence intensity (AU) of the Ca2+ flux measured at 20 seconds in permeabilized human microvascular endothelial cells from derm (HMVEC-d) stimulated with immune-mediated thrombotic thrombocytopenic purpura (iTTP) plasma samples of survivors (n=41) or non-survivors patients (n=21, **P<0.01). (B) Area under the curve (AUC) from Ca2+ flux curves after 30 minutes of HMVEC-d stimulated with iTTP plasma samples of survivors (n=41) or non-survivors (n=21, ***P<0.001). (C) Fluorescence intensity (AU) of the Ca2+ flux in HMVEC-d incubated for 20 seconds with plasma samples from iTTP patients in acute phase (iTTP-AP) or from same patients in remission (iTTP-R) (n=11, **P<0.01). Horizontal dotted line represents median Ca2+ mobilization induced in HMVEC-d by control plasma. (D) Von Willebrand Factor (VWF) secretion and tethering detected by fluorescence microscopy using rabbit anti-VWF antibodies and Alexa Fluor 594-conjugated donkey anti-rabbit immunoglobulin (red) after 1-hour-incubation of HMVEC-d with iTTP plasma samples collected in acute phase (A) or during remission (B). Cell nuclei are labeled in blue using DAPI (original magnification X40, scale bar=10 mm). (E) VWF fluorescence quantification after the HMVEC-d stimulation with iTTP plasma from patients in acute phase (iTTP-AP: n=4), or in remission (iTTP-R: n=4, *P<0.05).

