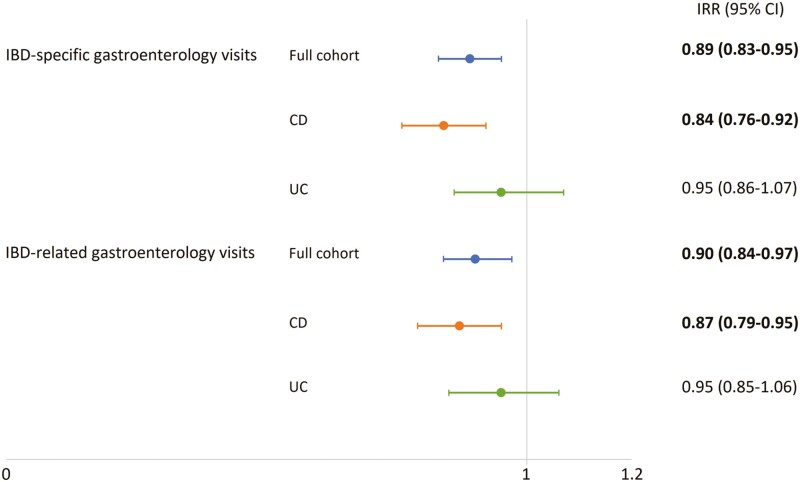
Figure 1.
Association between the location of residence at IBD diagnosis and rates of outpatient gastroenterology visits. The figure shows adjusted incidence rate ratios (IRRs) and 95% confidence intervals (95% CIs) for rural residents. Adjusted IRRs are presented for IBD-specific and -related visits in the full cohort analysis (blue lines), as well as in the Crohn’s disease (CD, orange lines) and ulcerative colitis (UC, green lines) groups. Bold values denote statistically significant results.

