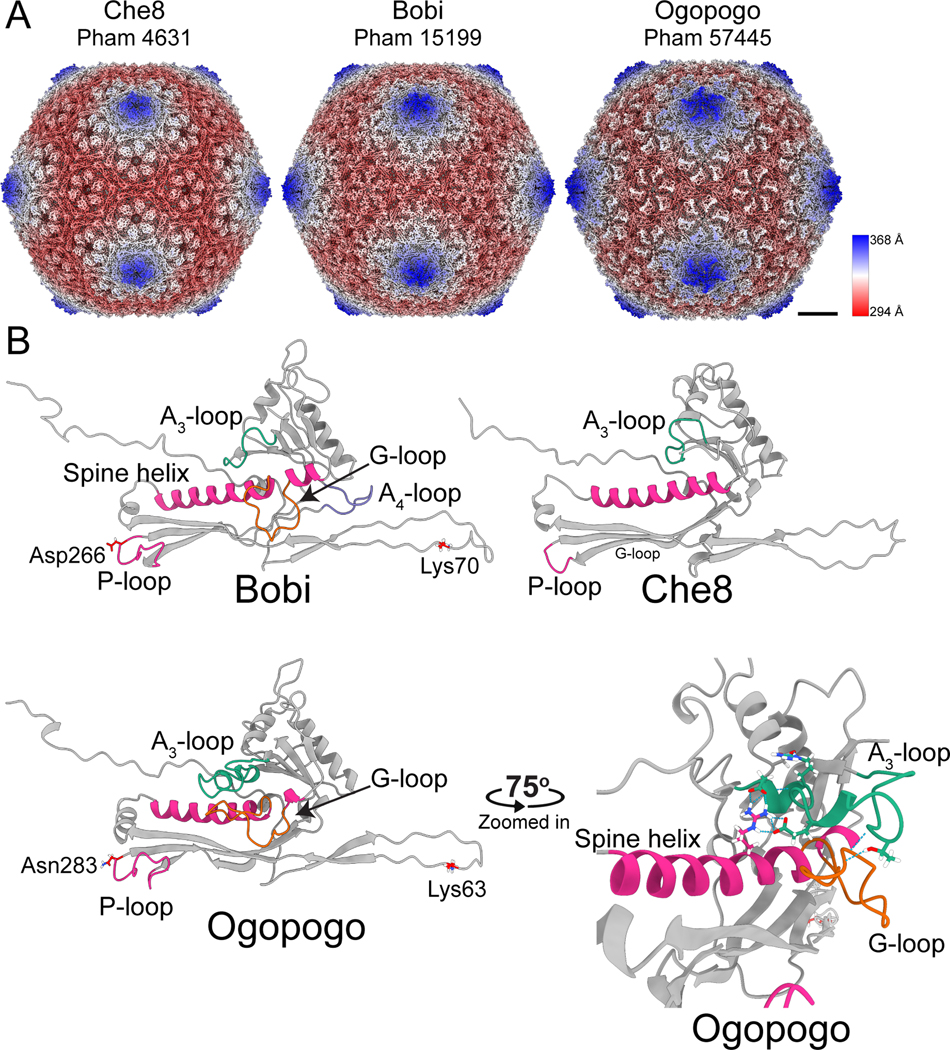
Figure 2. Structures of the F1 bacteriophages.
A) Surface representations of cryo-EM maps of capsids from the three representative major capsid protein phamilies of the F1 subcluster: Che8, Bobi, and Ogopogo. Each phamily number is displayed below the bacteriophage name. The capsids have been colored by the radial distance from the center of the capsid (the color key is shown on the right-hand side). Scalebar = 10 nm. B) Models of the HK97-fold of each representative bacteriophage with select areas highlighted and labeled. The lysines and aspartic acid/asparagine involved in the isopeptide bond of Bobi and Ogopogo are also labeled (Che8 does not have an isopeptide bond). A zoomed-in and rotated image of the A3-loop and G-loop of Ogopogo is shown bottom right. Throughout the paper, the cryo-EM derived HK97-folds shown are of equivalent positions in the capsid and are the hexamer subunit adjacent to the pentamer subunit in the asymmetric unit.

