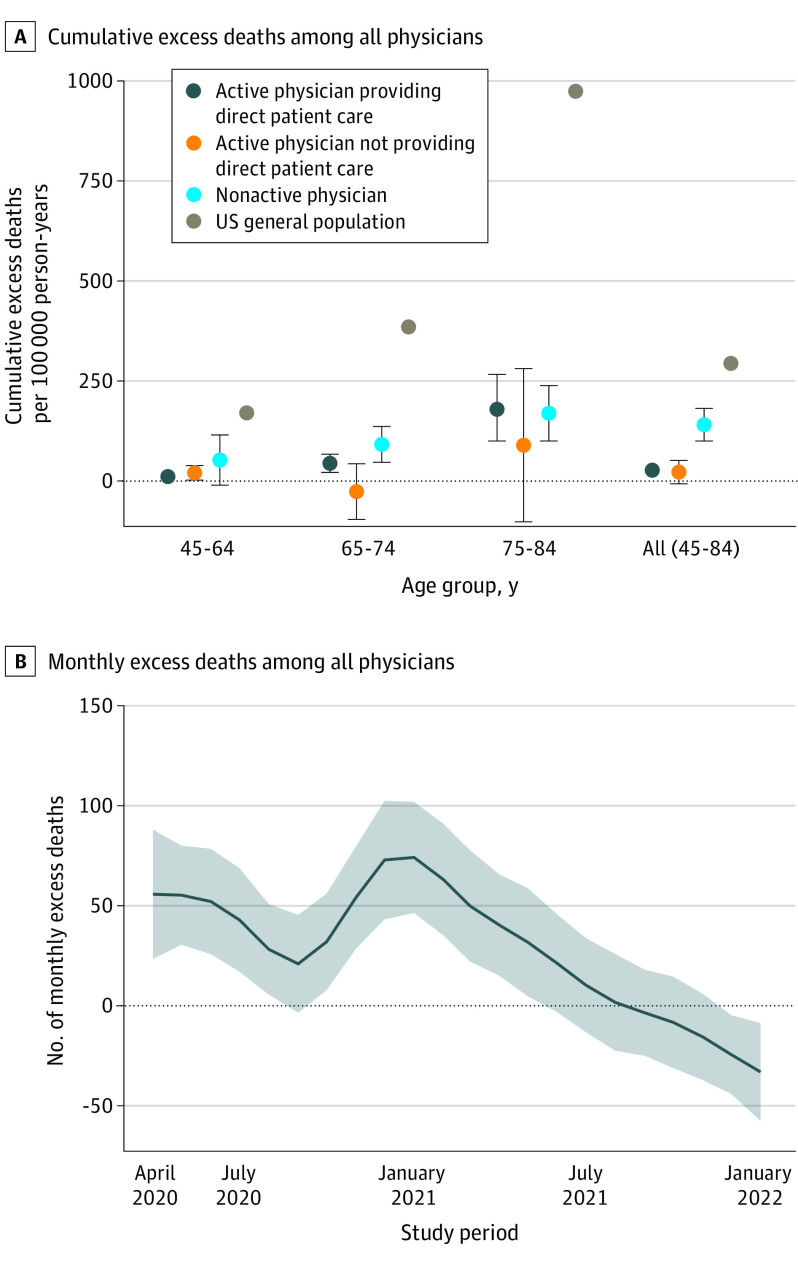
Figure. Excess Mortality Among Physicians From March 2020 Through December 2021.
A, Error bars represent 95% CIs of the excess death estimates. For reference, excess deaths in the US general population over the same period were included. B, The shaded area represents the 95% CI of the excess death estimate.

