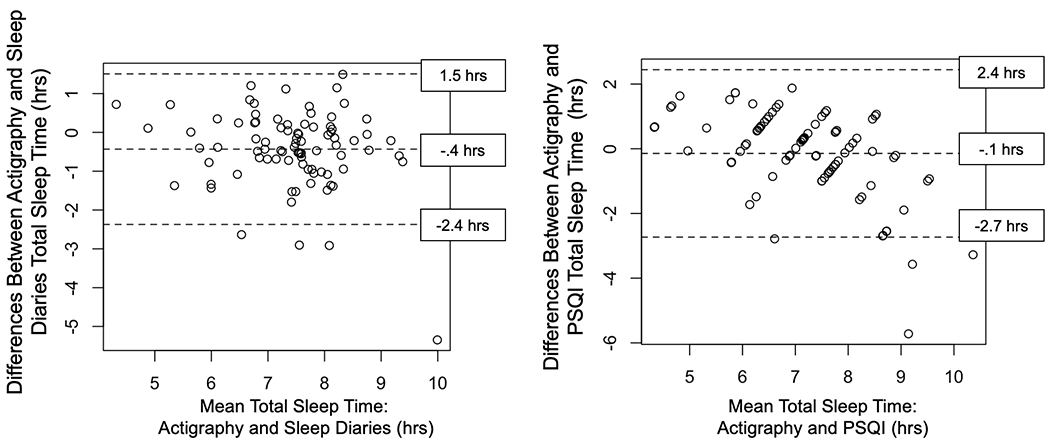
Figure 2.

Bland-Altman plots comparing actigraphy and sleep diaries (left panel) and comparing actigraphy and the Pittsburgh Sleep Quality Index (PSQI; right panel) for total sleep time in SAD. The middle-dashed line indicates the means of the differences (in hours) between the 2 methods. The dashed lines above and below those means indicate the 95% limits of agreement (1.96 × the standard deviation of the mean difference). Positive values indicate greater total sleep time measured by actigraphy.
