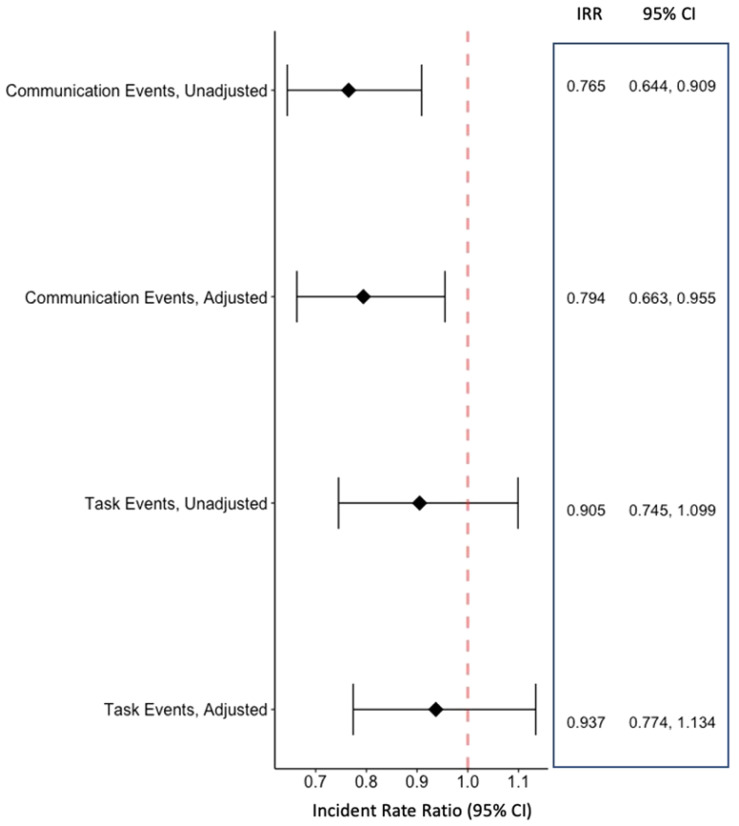
Figure 3. Associations between nonoperative task and communication events and hours of sleep determined by sleep log.
Incident rate ratios (IRR) represent the incident event rate per hour of sleep. IRR values are less than 1, indicating that an increasing amount of sleep was associated with a reduction in incident events. Adjusted models were adjusted for resident participation, hospital site, and operating room environmental events. CI = confidence interval.

