
Figure 2:
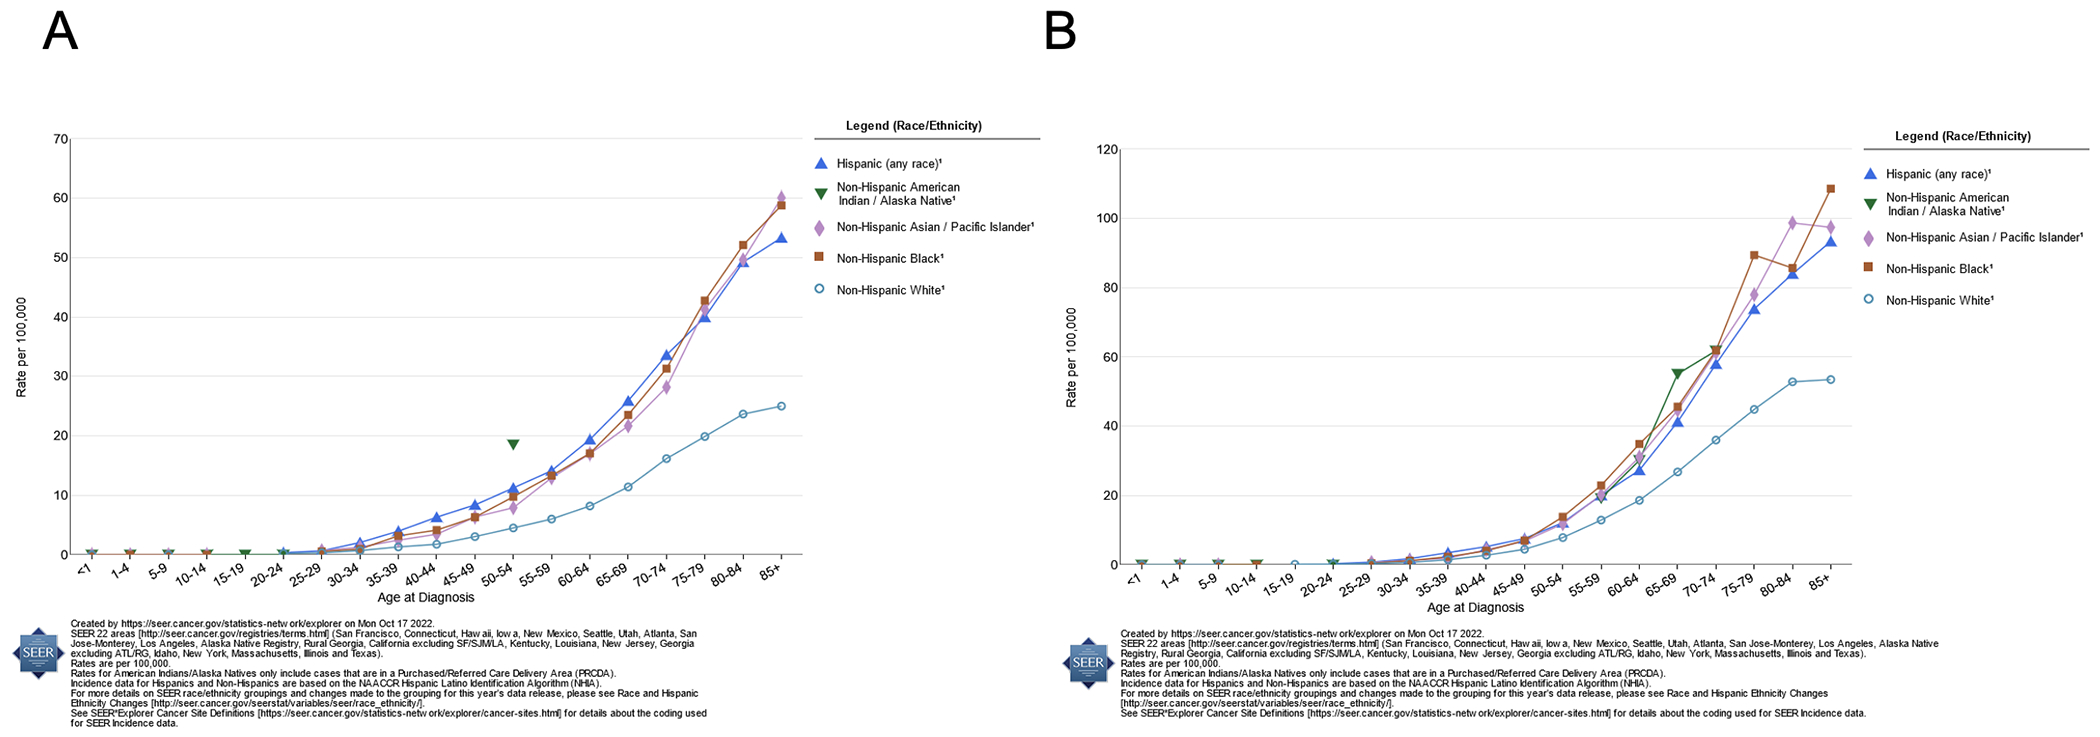
Delay-adjusted SEER stomach cancer incidence rates by age at diagnosis, 2015-2019, by race/ethnicity; panel A displays rates among women; panel B displays rates among men.
Official websites use .gov
A
.gov website belongs to an official
government organization in the United States.
Secure .gov websites use HTTPS
A lock (
) or https:// means you've safely
connected to the .gov website. Share sensitive
information only on official, secure websites.
Delay-adjusted SEER stomach cancer incidence rates by age at diagnosis, 2015-2019, by race/ethnicity; panel A displays rates among women; panel B displays rates among men.