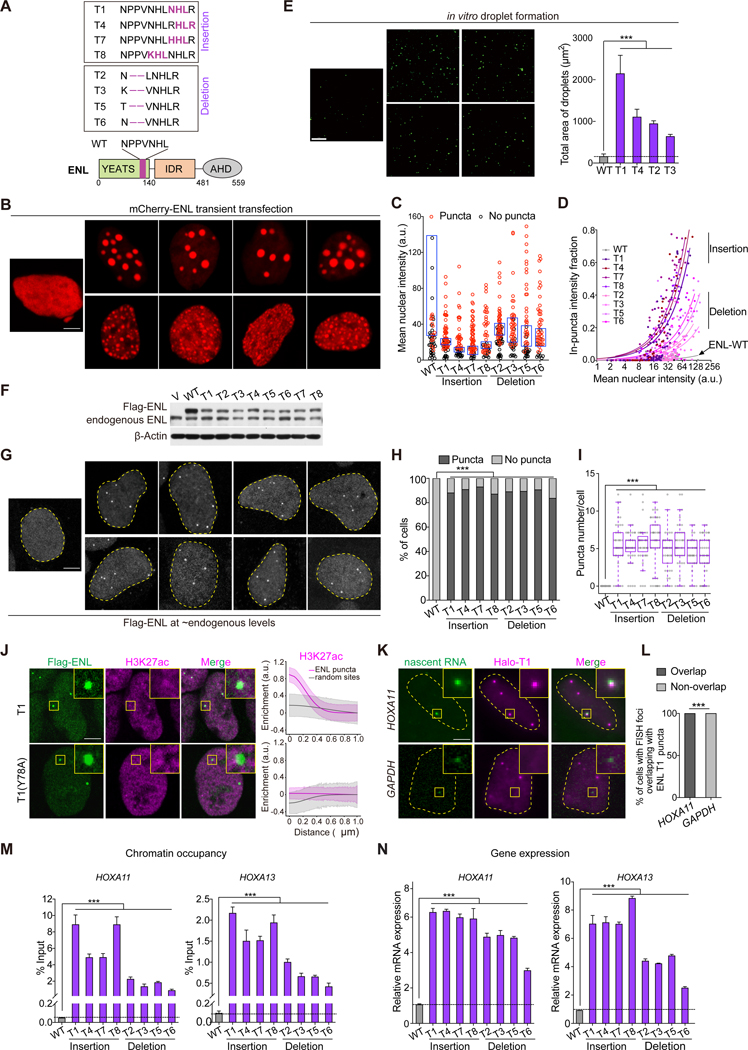
Figure 1. Near endogenous levels of ENL mutants form submicron-sized condensates at native genomic targets.
(A) Bottom, schematic of ENL protein structure. The mutated regions are in purple. IDR, intrinsically disordered region. AHD, ANC1 homologue domain. Top, protein sequences for ENL WT and mutant (T1-T8).
(B-D) Representative images (B) and quantification in HEK293 cells transfected with indicated mCherry-ENL constructs. B, all cells shown had similar mCherry-ENL intensities. C, plot showing puncta formation and mCherry intensities. Boxes highlight the top 25% highest mCherry-ENL levels among cells without detectable puncta. D, fraction of in-puncta fluorescence intensity as a function of mean nuclear intensity. Each dot indicates one cell (n at the range of 49~78).
(E) Representative images and quantification of in vitro droplet formation by indicated ENL(FL) constructs (375 nM).
(F) Western blotting showing near endogenous levels of WT and mutant Flag-ENL transgenes in HEK293 cells. V, empty vector.
(G-I) Flag IF staining (G) and quantification (H and I) in HEK293 cells. H, percentage of nuclei with and without Flag-ENL puncta. I, the number of puncta in each nucleus. Center lines indicate median and box limits are set to the 25th and 75th percentiles. H and I: cell number at the range of 32~49.
(J) IF staining of Flag-ENL (green) and H3K27ac (magenta) in HEK293 cells. The enrichment of H3K27ac at ENL puncta (magenta line) and random sites (gray line) was quantified. T1, n = 28 cells; T1(Y78A), n = 26 cells.
(K) Representative images (K) and quantification (L) showing co-localization of Halo-ENL-T1 puncta with HOXA11 nascent RNA FISH foci (n = 20 cells).
(M and N) ChIP-qPCR analysis of Flag-ENL occupancy at the HOXA locus (M) and mRNA expression (normalized to GAPDH) of HOXA genes (N) in HEK293 cells expressing endogenous levels of indicated Flag-ENL transgenes.
H and L: Chi-square test. E, I, M, N: two-tailed unpaired Student’s t-test. *** P < 0.001. E, M, N
Data represent Mean ± S.D.
See also Figures S1 and S2.

