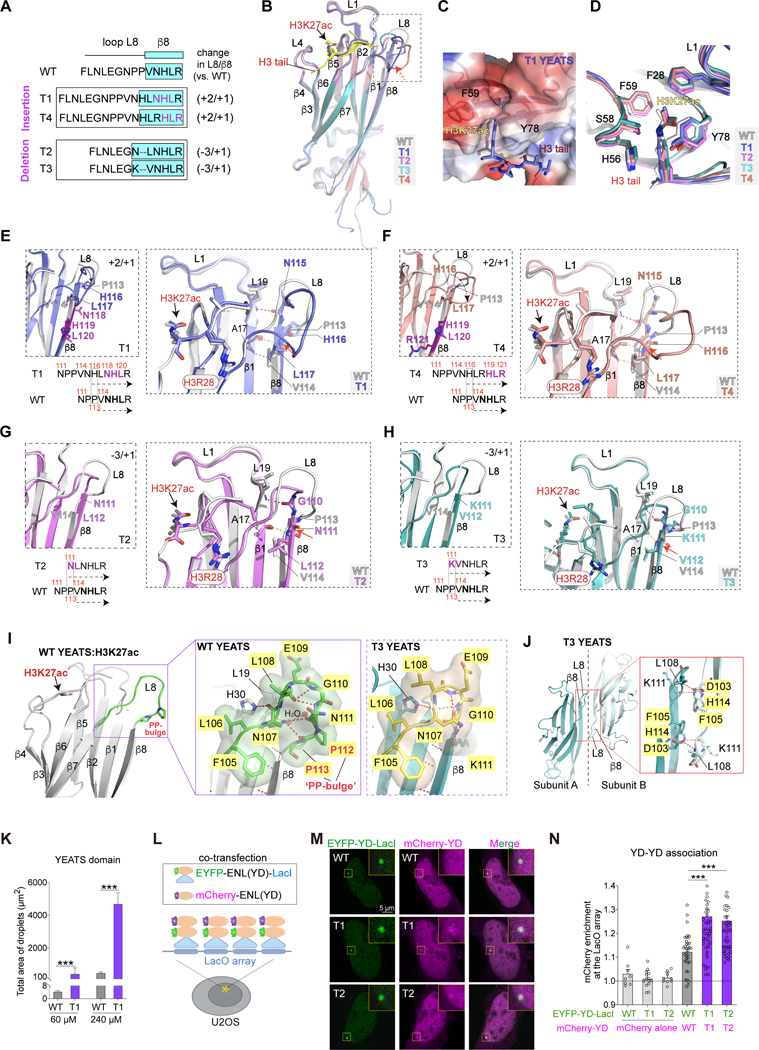
Figure 3. Insertion and deletion mutations induce consensus structural changes in the ENL YEATS domain.
(A) Top, schematic comparing loop L8 and β8 protein sequences in indicated ENL YEATS domains. Key residues are colored in purple. β8 strand is highlighted in cyan box. Right, changes in the number of residues in loop L8 and β8 in each mutant compared to WT.
(B) Overall structures of H3K27ac-bound ENL T1 (blue), T2 (magenta), T3 (cyan), and T4 (salmon) YEATS domain superimposed with WT (gray) YEATS:H3K27ac complex (PDB: 5J9S). H3K27ac is depicted as stick, and differences in loop L8 and β8 region are boxed. H3K27ac peptide in WT, T2, T3, T4 structures is in yellow; H3K27ac peptide in T1 structure is in blue.
(C) Details of H3K27ac-binding pocket of T1 YEATS domain.
(D) Comparison of key residues in WT, T1, T2, T3, and T4 YEATS domains that are involved in H3K27ac binding showing nearly identical conformations.
(E-H) Detailed analysis of local conformational changes between WT and mutant YEATS domains. Left, enlarged view of alignment of loop L8 and β8 region of WT and indicated mutant YEATS domains. Right, key residues forming extra hydrogen bonds and H3 peptides are highlighted.
(I) Close-up view of loop L8 in ENL WT (left and middle, PDB: 5J9S) and T3 (right) YEATS structures. Loop L8: green in WT, yellow in T3. P112P113 (PP) bulge is highlighted. Hydrogen bonds are shown as red dashed lines, water molecules as red spheres, and key residues as sticks.
(J) Crystal packing analysis of T3 YEATS structure revealing a YEATS-YEATS interaction mode that is mediated by β8-β8 association. Key residues and hydrogen bonds are shown in the red box.
(K) Quantification of in vitro droplet formation with purified ENL WT and T1 YEATS domains (60 μM and 240 μM).
(L) Schematic showing the use of LacI-LacO assay to test YEATS domain association in cells. (M and N) Representative images and quantification showing mCherry-ENL(YD) enrichment at the LacO array. M, yellow squares indicate the LacO array. N, enrichment of mCherry above 1 suggests YEATS domain self-association. n = 8, 14, 9, 36, 42, 41 cells from left to right.
K and N: Data represent Mean ± S.D., two-tailed unpaired Student’s t-test; *** P < 0.001. See also Figure S3 and Table 1.

