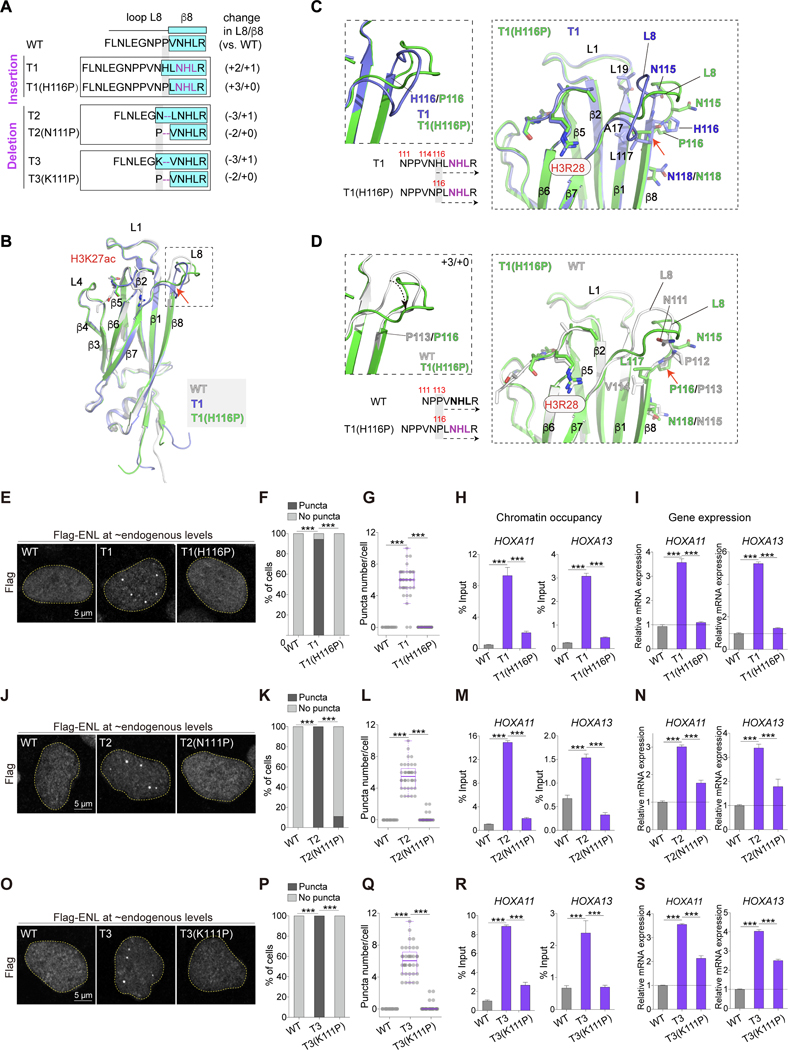
Figure 4. Reverting ENL mutation-induced structural changes abolishes condensate formation and function.
(A) Top, schematic comparing loop L8 and β8 protein sequences in indicated ENL YEATS domains. Key residues are colored in purple. β8 strand is highlighted in cyan box. Right, changes in the number of residues in loop L8 and β8 in each mutant when compared with WT.
(B) Overall structures of H3K27ac-bound T1 (blue) and T1(H116P) (green) YEATS domain superimposed with WT (gray) YEATS:H3K27ac complex. H3K27ac is depicted as stick and differences in loop L8 and β8 region are boxed.
(C and D) Detailed analysis of sequences (left) and local structural changes (right) between T1 and T1(H116P) (C) or WT and T1(H116P) (D).
(E-G, J-L, O-Q) Flag IF staining (E, J, O) and quantification in HEK293 cells expressing near endogenous levels of indicated Flag-ENL. F, K, P: percentage of nuclei with and without Flag-ENL puncta. G, L, Q: number of Flag-ENL puncta in each nucleus. Center lines indicate median and box limits are set to the 25th and 75th percentiles. Each dot indicates one cell (n at the range of 34~48).
(H, I, M, N, R, S) ChIP-qPCR analysis of Flag-ENL occupancy at the HOXA locus (H, M, R) and mRNA expression (normalized to GAPDH) of HOXA genes (I, N, S) in HEK293 cells. Data presents Mean ± S.D..
F, K, P: Chi-square test; G-I, L-N, Q-S: Two-tailed unpaired Student’s t-test; *** P < 0.001. See also Figure S4 and Table 1.

