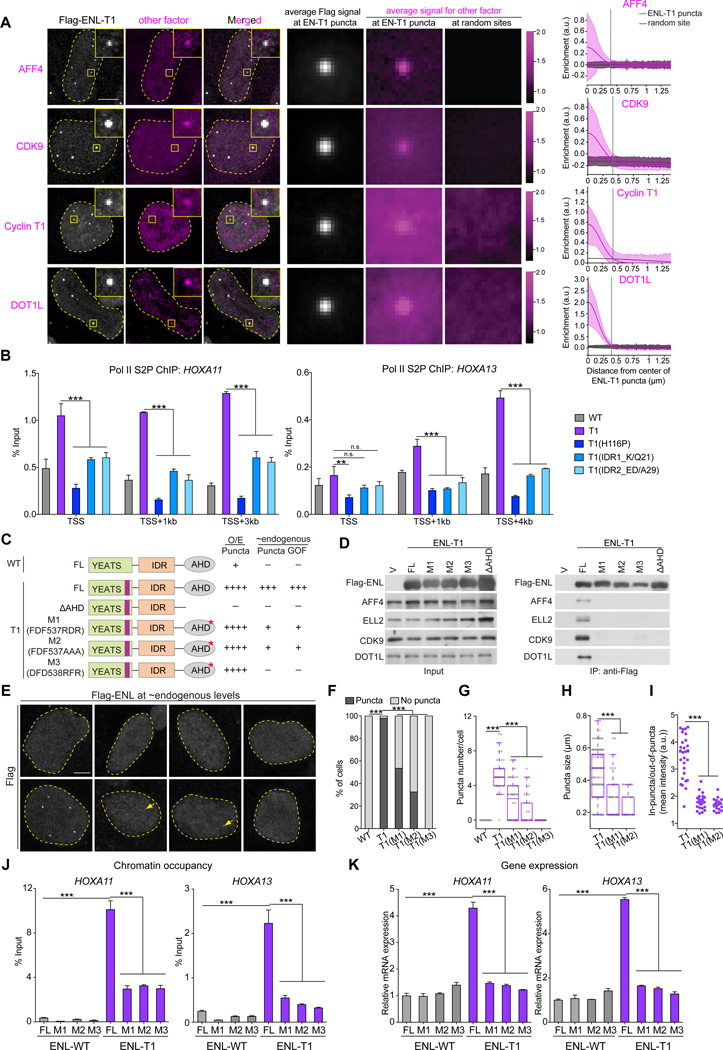
Figure 7. Interactions with extrinsic factors are critical for ENL mutant condensate formation and function.
(A) IF imaging (left) and quantification (right) showing enrichment of endogenous Halo-AFF4, Halo-CDK9, Cyclin T1, and DOT1L in Flag-ENL-T1 puncta over random sites. n = 185, 377, 62, 325 Flag-ENL-T1 puncta/random sites for AFF4, CDK9, Cyclin T1, DOT1L, respectively. (B) ChIP-qPCR comparing Pol II S2P occupancy at the HOXA locus in HEK293 cells expressing near endogenous levels of indicated Flag-ENL. Data shown are Mean ± S.D..
(C) Schematic showing different ENL variants and their ability to form puncta under overexpression (O/E) and form puncta and exhibit gain-of-function (GOF) on chromatin at endogenous levels.
(D) Immunoprecipitation followed by western blotting showing interactions between indicated Flag-ENL variants and known ENL interaction partners.
(E-I) Flag IF staining (E) and quantification (F-I) in HEK293 cells expressing near endogenous levels of indicated Flag-ENL. E, yellow arrows indicate smaller puncta formed by T1(M1) and T1(M2). F, percentage of nuclei with and without Flag-ENL puncta; G, the number of Flag-ENL puncta in each nucleus. F and G: cell number at the range of 40~55. Center lines indicate median and box limits are set to the 25th and 75th percentiles. H, puncta size (n at the range of 42~273). I, the in puncta/out-of-puncta intensity ratio (n at the range of 20~28).
(J and K) ChIP-qPCR analysis of Flag-ENL occupancy at the HOXA locus (J) and mRNA expression analysis (normalized to GAPDH) of HOXA genes (K) in HEK293 cells with near endogenous levels of indicated Flag-ENL. Data shown are Mean ± S.D..
F: Chi-square test; B, G-K: two-tailed unpaired Student’s t-test; *** P < 0.001, ** P < 0.01. n.s., no significance.
See also Figure S7.

