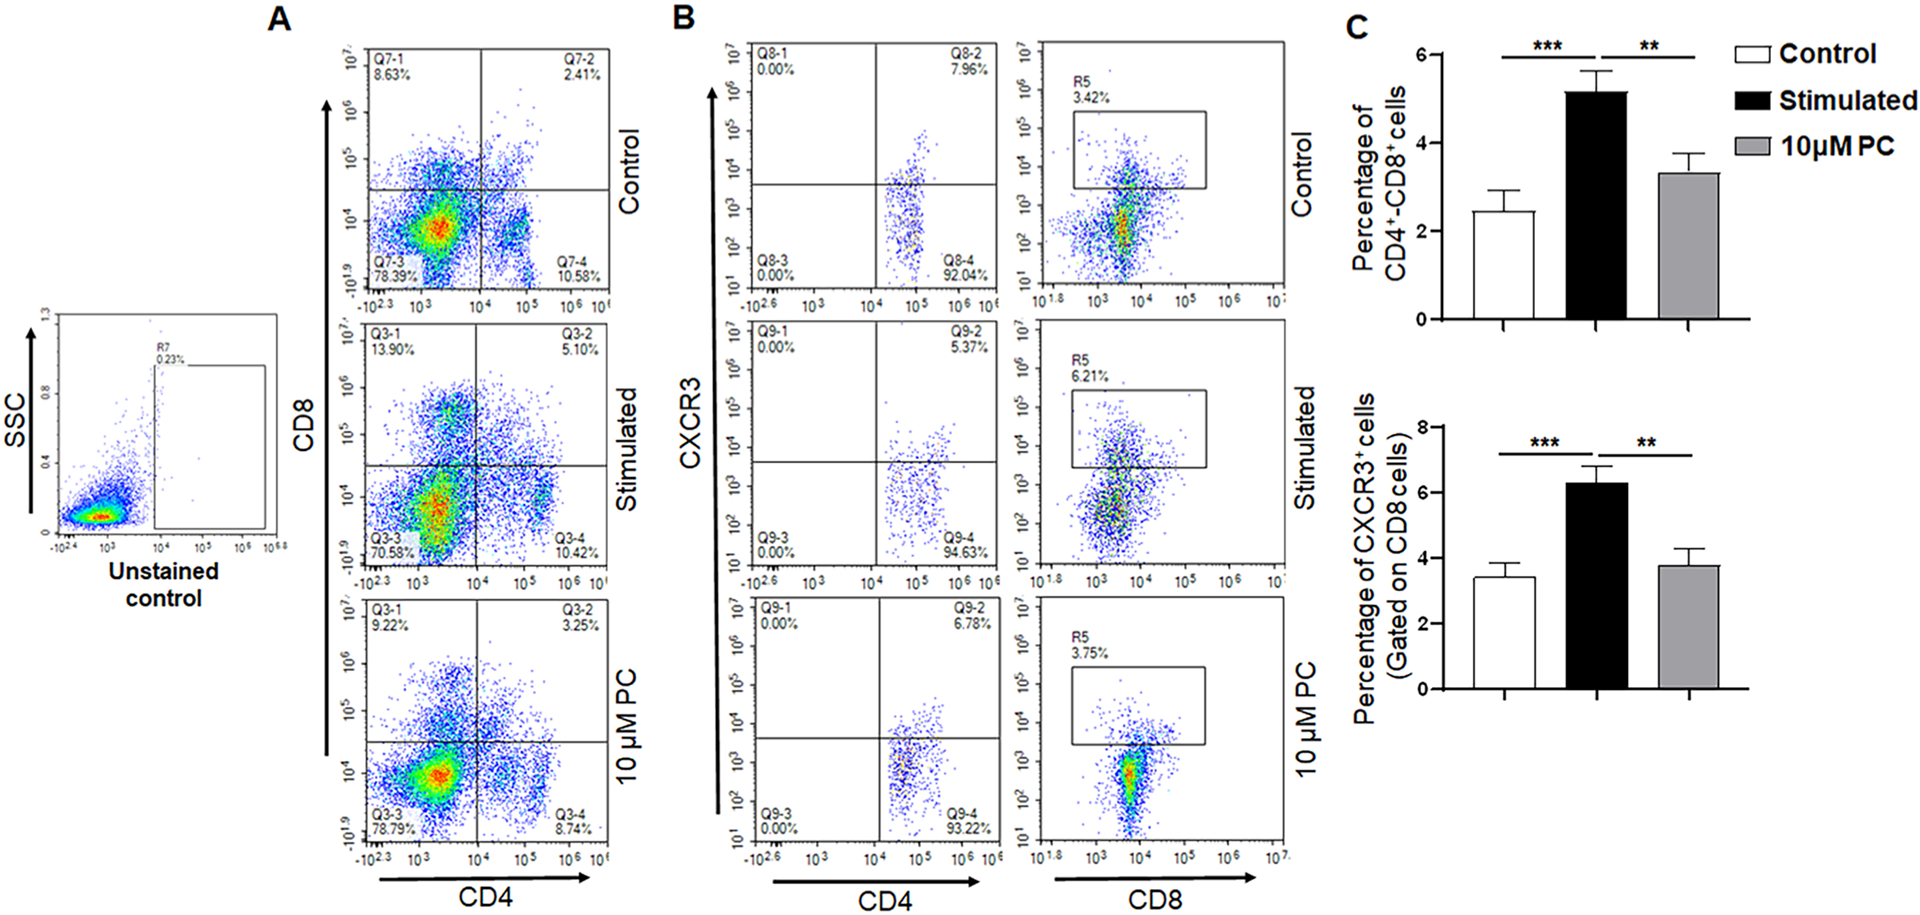
Fig. 1. PC alters the T cell frequency and reduces activated T cells.

Flow cytometry analysis of control stimulated, and 10 μM PC treated spleen cells stained with phenotypic markers for T cells (CD4 and CD8) and T cell activation markers CXCR3. Panel A represents the percentages of CD4+ T cells (Panel A, lower right quadrant), CD8+ T cells (Panel A, upper left quadrant), and CD4+CD8+ T cells (Panel A, upper right quadrant). Panel B shows representative experiments for both CD4 +CXCR3 and CD8 +CXCR3 populations. Panel C represents the percentages of CD4+CD8+ T cells and CXCR3 cells that were gated on the CD8 T cell population. Data are representative of one of the three biological experiments run in triplicate. The values are shown as mean ± SEM; * *p ≤ 0.01 (compared to control vs stimulated); * **p ≤ 0.001 (compared to stimulated vs PC).
