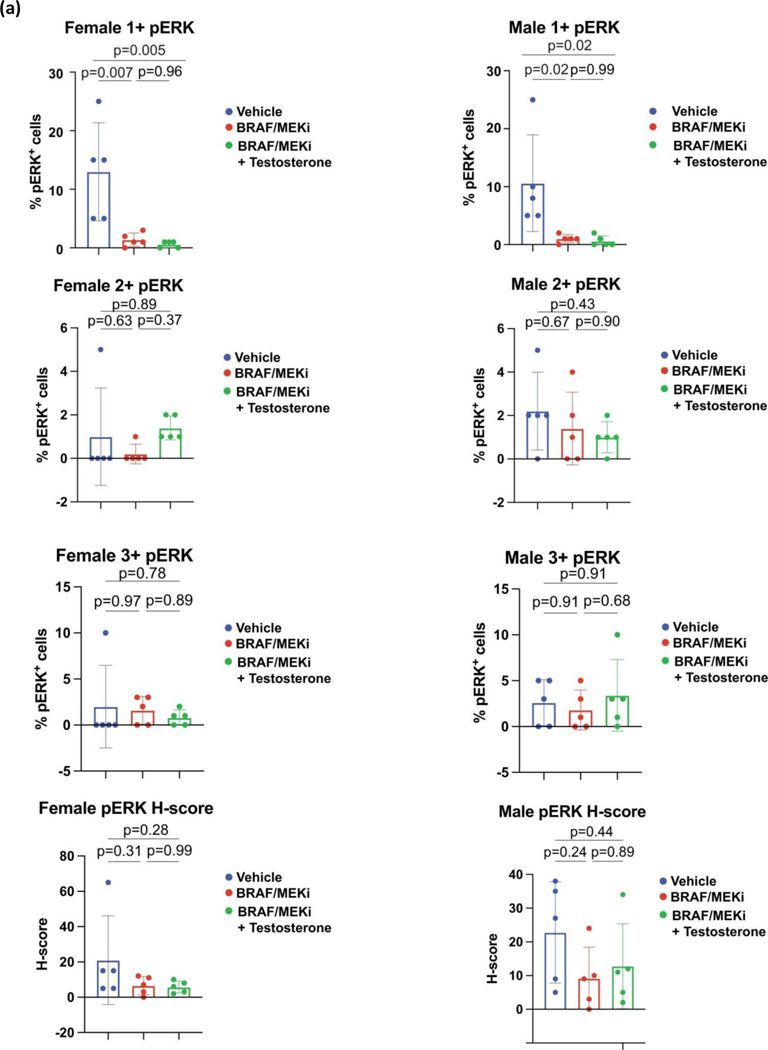
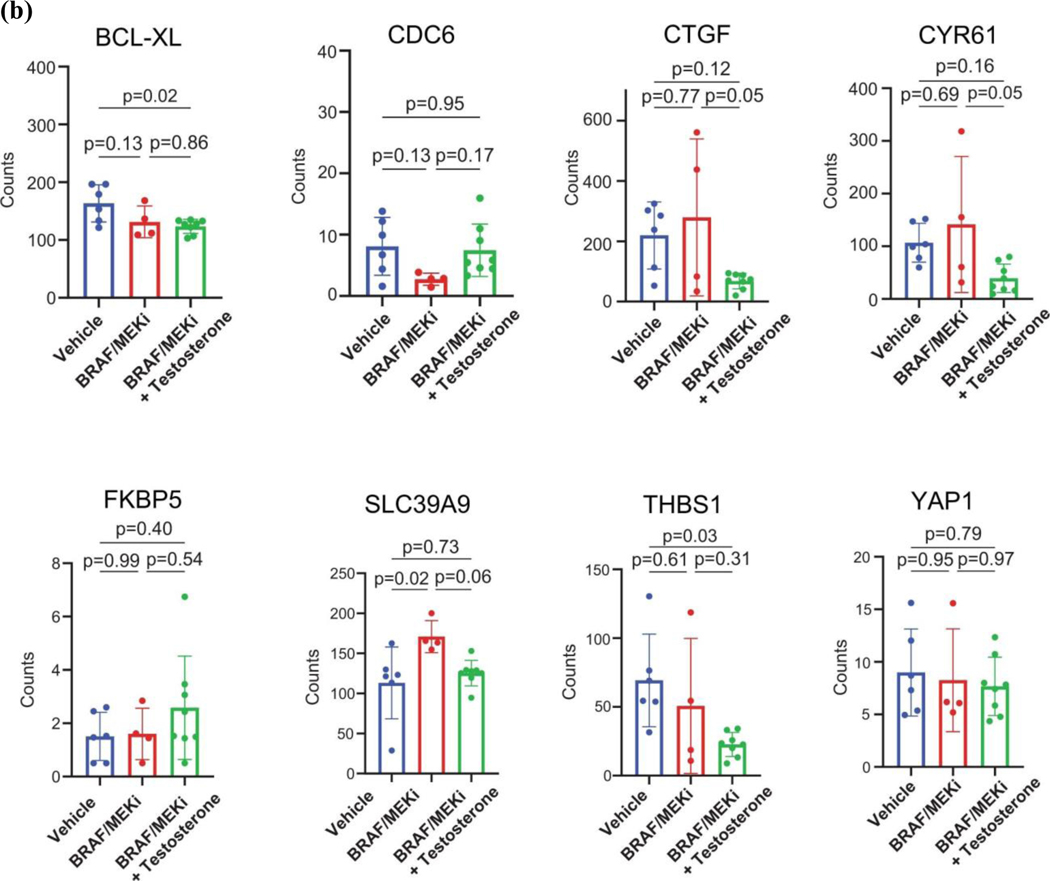
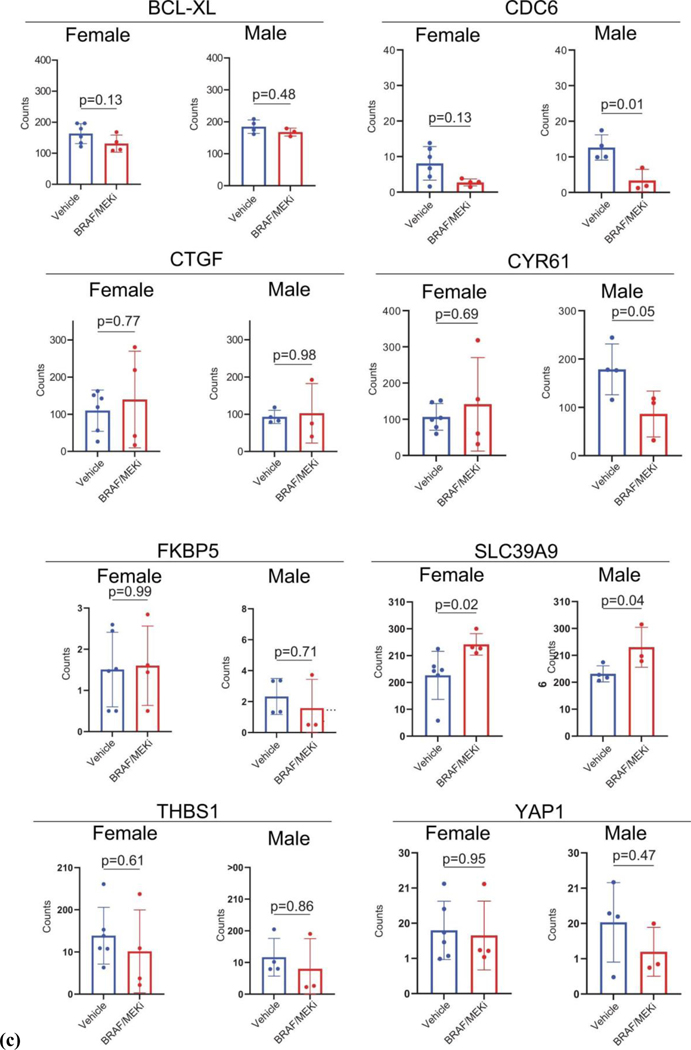
Extended Data Fig. 9: Effect of BRAF/MEKi on pERK, ZIP9/YAP1 associated transcripts and YAP1 associated transcripts in BP tumours.
A) Staining and quantification of phosphor-ERK in BP tumours of female and male mice on treated with vehicles, BRAF/MEK inhibition, or BRAF/MEK inhibition + testosterone. Histogram represent mean + SD. Differences were calculated using one-way ANOVA (n = 5/group). B) Staining and quantification of ZIP9/YAP1 associated transcripts in BP tumours of female and male mice on treatment with vehicles (n = 6), BRAF/MEK inhibition (n = 4), or BRAF/MEK inhibition + testosterone (n = 8). Histogram represent mean + SD. Differences were calculated using one-way ANOVA. C) Staining and quantification of YAP1 associated transcripts in BP tumours of female and male mice on treatment with vehicles (n = 6 females, 4 males) or BRAF/MEK inhibition (n = 4 females, 3 males. Histogram represent mean + SD. Differences were calculated using one-way ANOVA.


