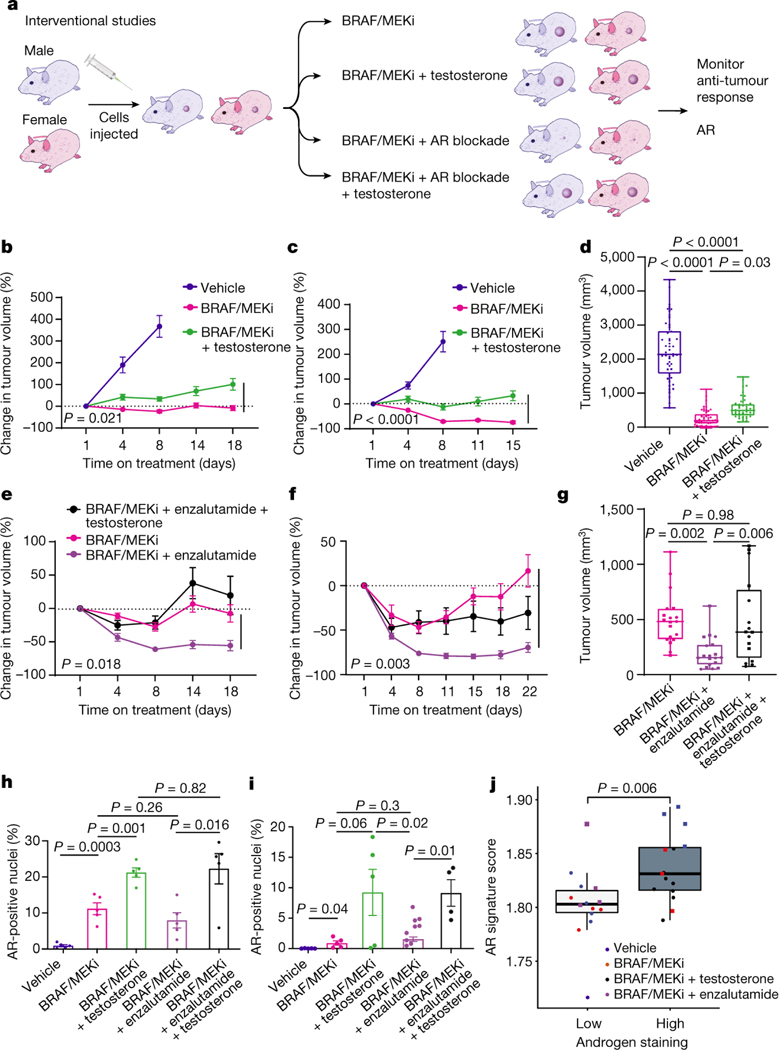
Fig. 3: Modulation of AR activity is associated with differential response to BRAF/MEK-targeted therapy.
a, Schematic of mouse studies. b,c, The percentage change in BP tumour growth in male (b) or female (c) C57BL/6 mice treated with vehicle (n = 10 male and n = 10 female mice), BRAF/MEKi alone (n = 9 male and n = 10 female mice) or BRAF/MEKi + testosterone (n = 9 male and n = 10 female mice) (P = 0.021 (male) and P < 0.0001 (female)). d, Aggregate end-point tumour volumes showing larger volumes in mice treated with BRAF/MEKi + testosterone (n = 41) versus BRAF/MEKi (n = 49) (P = 0.031). n = 50 for vehicle. The squares represent male mice, and the dots represent female mice. e,f, The percentage change in BP tumour growth in male (n = 10 per group) (e) or female (n = 10 per group) (f) C57BL/6 mice treated with BRAF/MEKi alone or BRAF/MEKi + enzalutamide (P = 0.018 (male) and P < 0.003 (female)) or enzalutamide + testosterone (P < 0.0001 (male) and P < 0.0001 (female)). g, Aggregate end-point tumour volumes showing smaller volumes in mice treated with BRAF/MEKi + enzalutamide versus BRAF/MEKi (P = 0.002) and larger tumour volumes with the addition of testosterone (P = 0.005). The squares represent male mice and the dots represent female mice. Data from b and c are from the same experiment, and data from e and f are from separate experiments. h,i, Quantification of the percentage of AR+ nuclei by immunofluorescence analysis of BP tumour samples collected from male mice treated as indicated for 18 days (n = 5 per group; vehicle versus BRAF/MEKi (P = 0.0003), BRAF/MEKi versus BRAF/MEKi + testosterone (P = 0.001)) (h) or female mice treated for 15 days (i) (vehicle (n = 5) versus BRAF/MEKi (n = 5) (P = 0.04), BRAF/MEKi + testosterone (n = 5) versus BRAF/MEKi + enzalutamide (n = 9) (P = 0.02), BRAF/MEKi + enzalutamide versus BRAF/MEKi + enzalutamide + testosterone (n = 4) (P = 0.01)). P values were calculated using two-sided t-tests. Data are mean ± s.e.m. j, Androgen signalling score comparing mouse tumours with low (n = 14; female, vehicle; female, BRAF/MEKi; and male, BRAF/MEKi + enzalutamide) versus high (n = 15; male, vehicle; male, BRAF/MEKi; and female, BRAF/MEKi + testosterone) androgen staining (P = 0.0059). The squares represent male mice and the dots represent female mice. The box plots in d, g and j show the median (centre line), interquartile range (IQR) (box limits) and the most extreme point within 1.5 × IQR (whiskers). The tumour growth curves in b, c, e and f show mean ± s.e.m.

