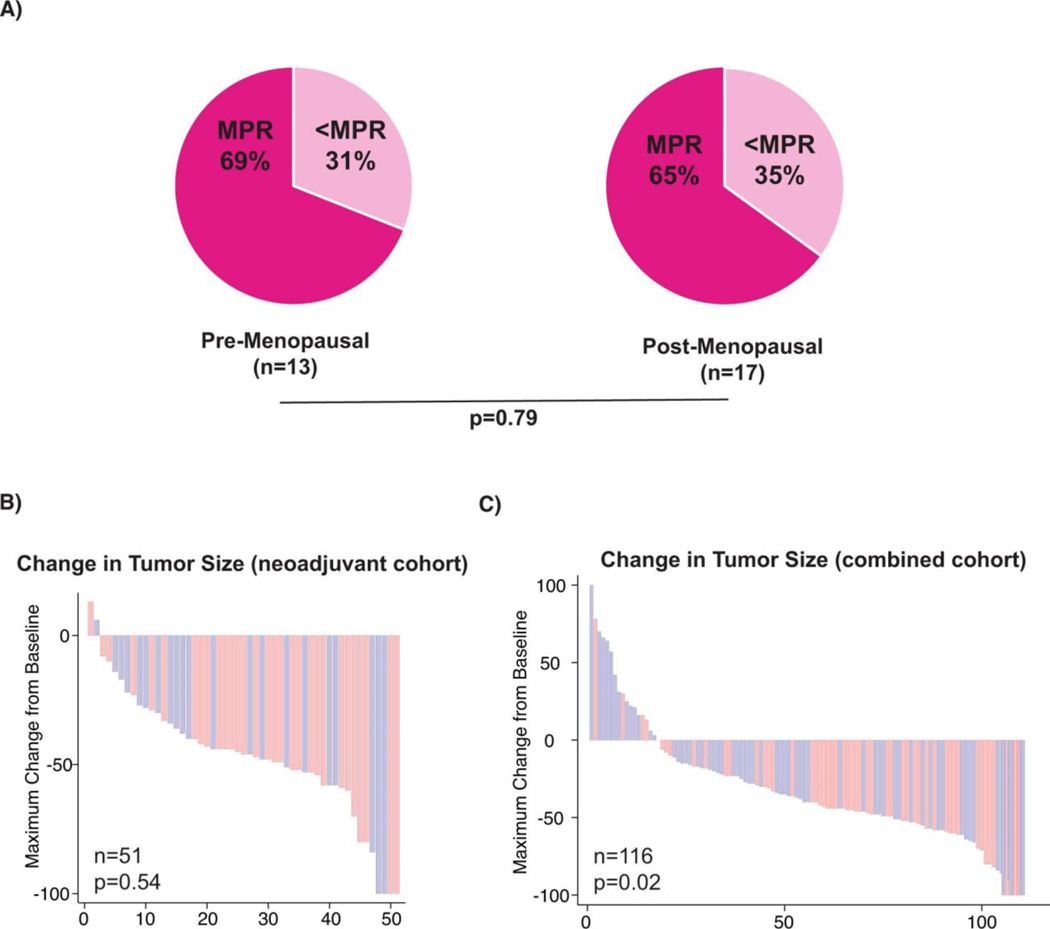
Extended Data Fig. 1: Expanded analysis of clinical cohorts.
A) Rates of major pathologic response (MPR) based on menopausal status of female patients within the neoadjuvant cohort (p = 0.79) by logistic regression. B) Waterfall plot of percent change in tumour size by cross-sectional imaging in the neoadjuvant cohort (p = 0.54). C) Waterfall plot of percent change in tumour size by cross-sectional imaging of the pooled neoadjuvant and metastatic cohorts (p = 0.02).

