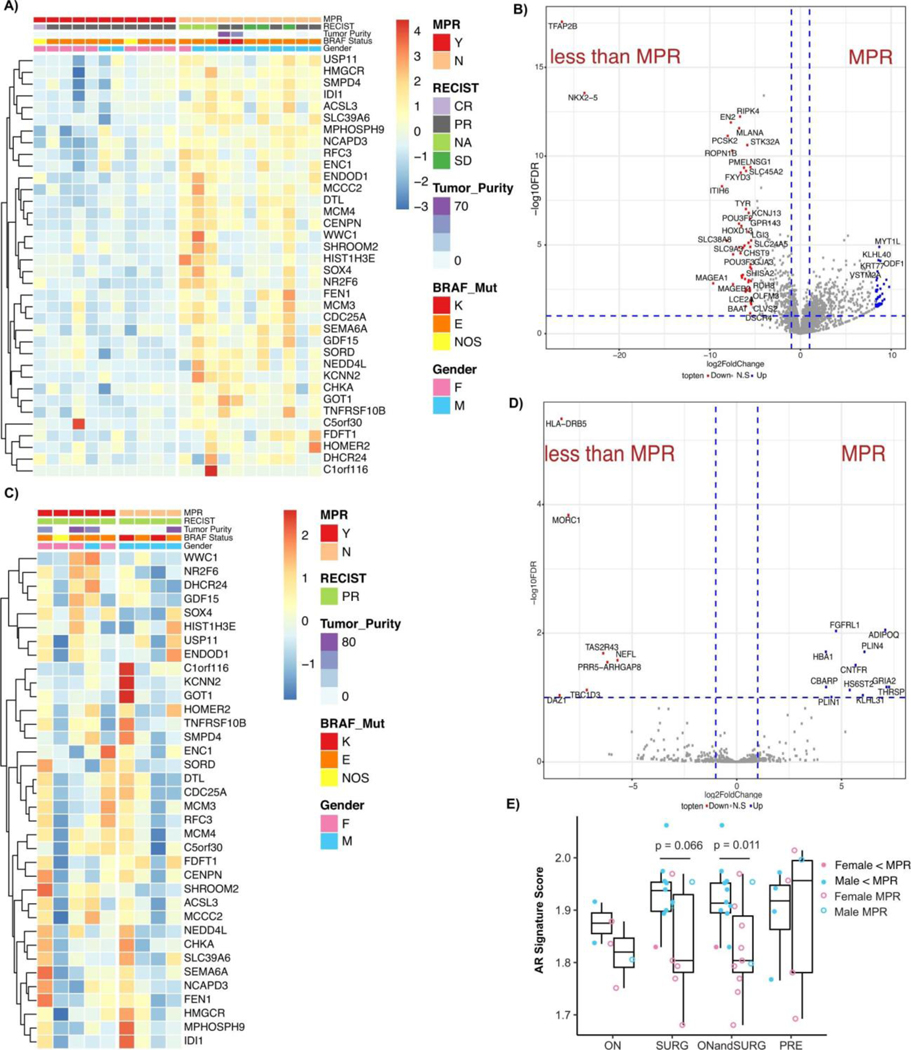
Extended Data Fig. 3: Transcriptomic analysis of clinical specimens.
A) Heatmap of AR signature genes of on-treatment specimens demonstrating upregulation of AR signature pathways. B) Volcano plot of differentially expressed genes after whole transcriptomic analysis of on-treatment with BRAF/MEK inhibition clinical specimens. Vertical dotted blue lines represent log foldchange greater than 2. Horizontal dotted blue line represents q < 0.05. Genes with log fold change greater than 5 and q < 0.05 are labelled. C) Heatmap of AR signature genes of pre-treatment specimens of AR signature pathways. D) Volcano plot of differentially expressed genes after whole transcriptomic analysis of pre-treatment with BRAF/MEK inhibition clinical specimens. E) Androgen signalling score comparing clinical samples achieving an MPR and those not achieving an MPR for those on treatment (ON, <MPR n = 2, MPR n = 4), at the time of resection (SURG, <MPR n = 9, MPR = 7; p = 0.066), aggregate of those on treatment and surgically resected (ONandSURG, <MPR = 11, MPR = 11; p = 0.011), and samples collected prior to treatment (PRE, <MPR n = 4, MPR n = 5; p = 0.95); groups were compared using a two-sided Student’s t test. Box plot represents the median bar with the box bounding interquartile range (IQR) and whiskers to the most extreme point within 1.5 x IQR.

