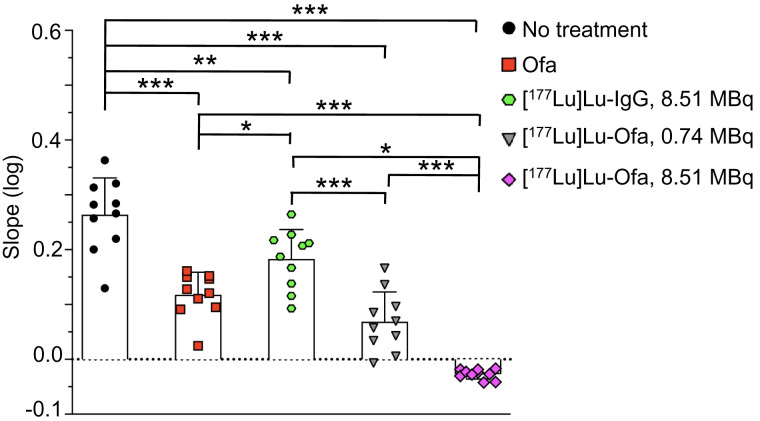
FIGURE 5.
Tumor-cell growth in mice 1–18 d after initiation of therapy. Log of slopes of radiance (photons/s/cm2/steradian) over this time are shown as mean ± SD and were analyzed by ANOVA, comparing all samples with each other (10 mice per group). *P < 0.05. **P < 0.005. ***P < 0.0001. Ofa = ofatumumab.

