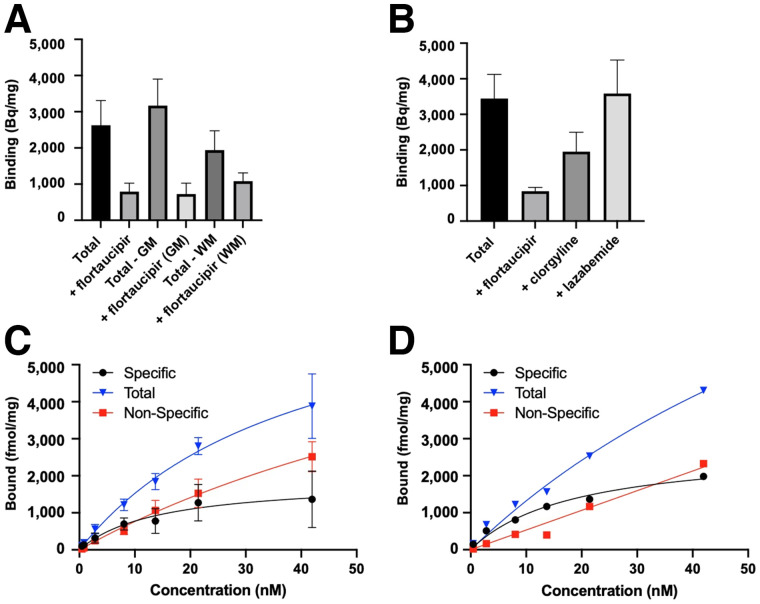
FIGURE 1.
3H-flortaucipir binding in CTE IV and AD. (A) Quantification of 3H-flortaucipir (5 nM) total signal compared with homologous block signal in whole section, gray matter, and white matter of CTE cases. Binding is reported in Bq/mg (n = 12). (B) Quantification of 3H-flortaucipir (5 nM) total signal compared with blocking under homologous conditions (10 μM), clorgyline (10 μM) for MAO-A, or lazabemide (10 μM) for MAO-B (n = 3) of CTE cases. (C and D) Saturation analysis with increasing 3H-flortaucipir concentration in CTE (n = 4) (C) and AD (n = 1) (D) tissue sections to quantify Bmax and Kd. GM = gray matter; WM = white matter.

