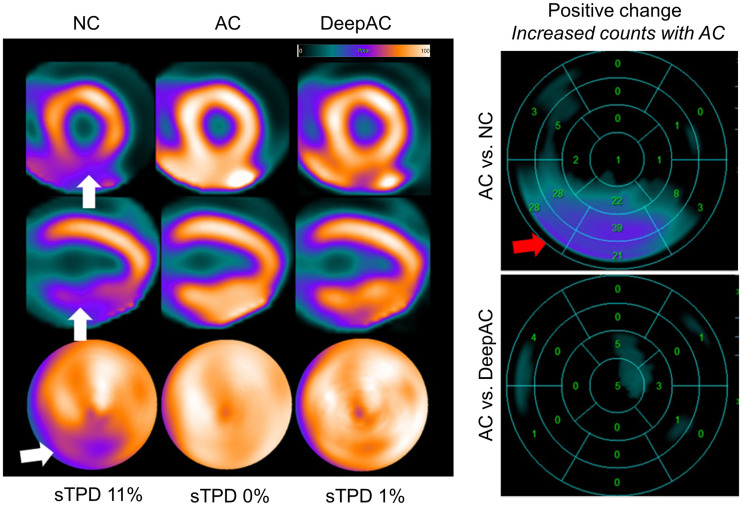
FIGURE 5.
NC, AC, and DeepAC images from 53-y-old man with body mass index of 36. On short-axis images (top), vertical long-axis images (middle), and polar maps (bottom), there was defect in inferior wall on NC images only (white arrows), with evidence of adjacent radiotracer activity in abdomen. Standard quantification by stress TPD (sTPD) was 11% (abnormal). After AC correction, sTPD was 0%; DeepAC correction resulted in sTPD of 1% (both normal). There was positive change in inferior wall counts for AC vs. NC (red arrow). There was no change between AC and DeepAC images. Patient had no CAD on coronary CT angiography, and defect most likely represents diaphragmatic attenuation.

