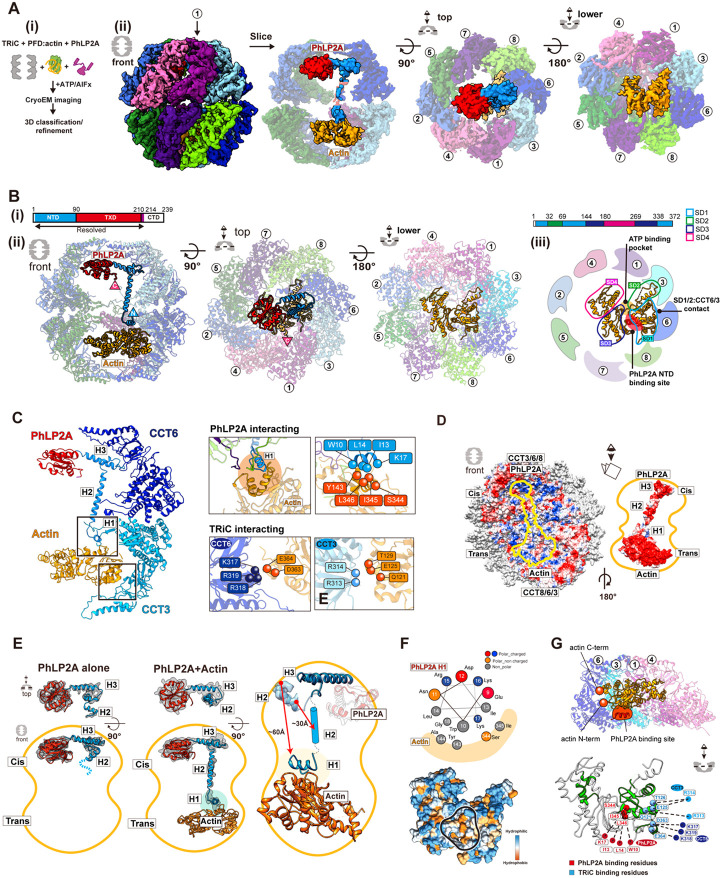
Figure 6. CryoEM structure of closed TRiC with folded actin and PhLP2A occupying each fold ing chamber.
(A) CryoEM structure determination of closed TRiC with folded actin and PhLP2A in each chamber. (i) Sample preparation scheme for the substrate-cochaperone encapsulated TRiC. (ii) 3D reconstructi on map of folded actin and PhLP2A encapsulated in closed TRiC. The density of H2 of PhLP2A is low-pass filtered and depicted at σ = 1.4 from the density map of the full complex. CCT1 is indicat ed by an arrow. (B) Atomic model of closed PhLP2A-β-actin-TRiC (i) Schematic of the model of Ph LP2A. Modeled domains are color coded. (ii) Front, top, and bottom slice views of PhLP2A and fold ed actin encapsulated inside the closed TRiC model. (iii) Summary of actin structural features inside the folding chamber. SD1 is the major binding site with the intermediate domain of CCT3/6. The Ph LP2A binding site is between SD1 and SD3 (indicated by a red circle), and the ATP binding pocket is on the opposite side, between SD2 and SD4 with fewer constraints (indicated by an orange mark er). (C) Detailed interactions between PhLP2A, CCT subunits, and folded actin. (Left) Interactions between the PhLP2A NTD or CCT3 and actin. (Right) (Top) Note that H1 of PhLP2A and CCT3 show direct interaction with actin, forming a local hydrophobic interaction network. Interacting residues are represented as balls. (Bottom) Interacting residues between actin and CCT3/6 are shown as balls. (D) Electrostatic surface of the closed TRiC folding chambers (left), and PhLP2A and actin (right). A symmetric charge distribution inside the closed folding chamber leads to a positively charged surface along the PhLP2A NTD and actin-binding surface. (E) The comparison between PhLP2A with and without actin in the closed folding chamber. Conformational changes of PhLP2A induced by the enca psulated substrate are represented. Once actin is encapsulated in the trans chamber, H1 and H2 of PhLP2A in the cis chamber stretch and traverse the chamber, undergoing a conformational shift of a round ~ 60 A, leading to direct contact between H1 and actin. TXD and CTD display no change up on substrate encapsulation. (F) The helix wheel plot and hydrophobic surface of encapsulated actin showing the actin-PhLP2A contact sites. (G) (Top) The slice view of the actin-TRiC contact site. CC T4,1,3,6 and actin are shown. N and C terminus of actin are represented as balls and PhLP2A binding site is colored in red. (Bottom) The folding defect mutant residues colored in green on the enca psulated actin structure (Rommelaere et al., 2003). Red balls indicate the residues interacting with P hLP2A while blue balls represent CCT interacting residues.

