. 2023 Jan 31;83(7):1111–1127. doi: 10.1158/0008-5472.CAN-22-2553

Figure 3.

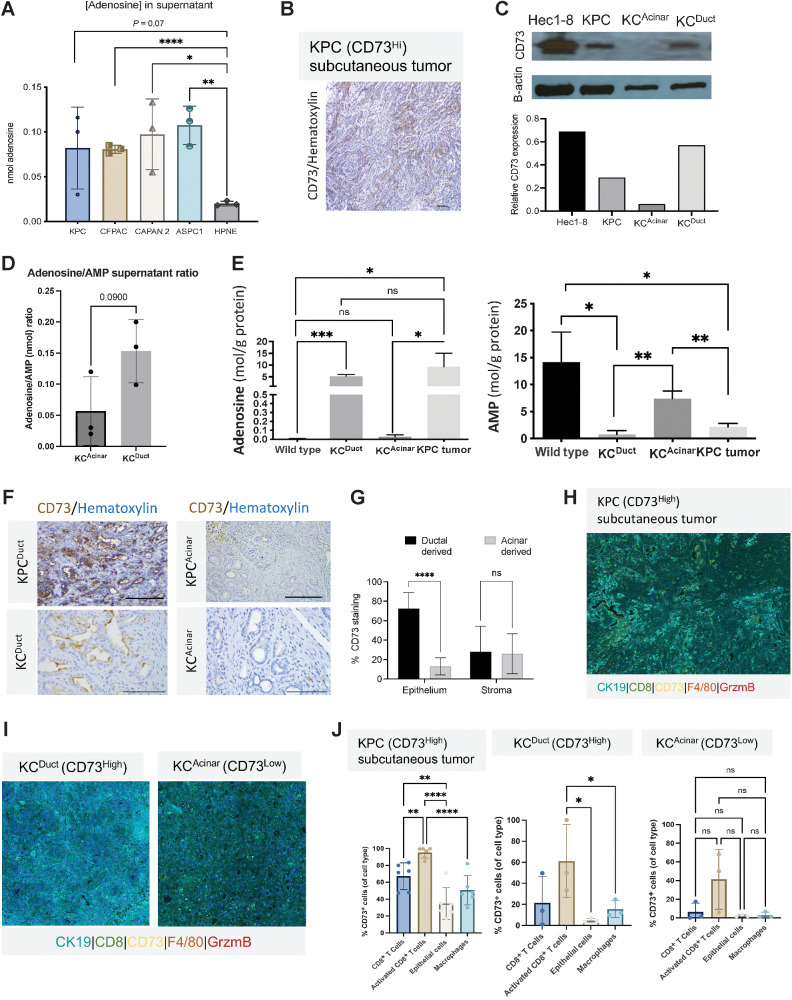
Figure 3. CD73 expression levels on epithelial cells and immune cells correlate with adenosine concentrations in supernatant and tissue. KCDuct and KPC subcutaneous tumors present the highest intratumoral levels of adenosine. A, Supernatant adenosine levels are significantly increased in PDAC cell lines relative to control pancreatic cells (HPNE; P < 0.05; P < 0.001; P < 0.0001), a Student t test was used for statistical comparison. B, IHC images of CD73+ KPC tumor. C, Western blot image and quantification of CD73 levels in Hec1-8 cell lines and lysates from KPC subcutaneous tumors, KCAcinar, and KCDuct pancreata. D, HPLC analysis of the adenosine:AMP ratio from ex vivo–cultured KCDuct and KCAcinar pancreata at the time of euthanasia (n = 3 mice per group). Adenosine:AMP ratios are elevated in cultured KCDuct pancreata compared with KCAcinar pancreata (P = 0.09). E, HPLC analysis of adenosine and AMP levels in WT pancreas, KCDuct or KCAcinar N = 3 samples per group. Intrapancreatic adenosine levels are significantly elevated in KCDuct pancreata consistent with high CD73 expression in KCDuct neoplasia (**, P < 0.01) and intrapancreatic AMP levels are highest in WT and KCAcinar tissue indicating lack of CD73 activity in these tissues (*, P < 0.05). F, Representative CD73 IHC showing high percentage expression of CD73 in ductal-derived PDAC from both KPCDuct and KCDuct when compared with acinar-derived PDAC from KPCAcinar and KCAcinar. G, ImageJ quantification of CD73 expression in the epithelium compared with stroma in ductal-derived compared with acinar-derived PDAC. A Student t test was used for statistical analysis (****, P < 0.0001; ns; n = 5). H, Representative composite multiplex immunofluorescent image from a KPC subQ tumor and (I) KCDuct and KCAcinar pancreata. J, Quantitative assessment of KPC subQ tumor, KCDuct and KCAcinar pancreata using multiplex immunofluorescence. In all groups, activated CD8+ T cells have the highest fluorescence intensity compared with CD8+ T cells, epithelial cells, and macrophages. The overall percentage of CD73 cells was the highest in KPC and KCDuct samples compared. Scale bars, 50 μm.

CD73 expression levels on epithelial cells and immune cells correlate with adenosine concentrations in supernatant and tissue. KCDuct and KPC subcutaneous tumors present the highest intratumoral levels of adenosine. A, Supernatant adenosine levels are significantly increased in PDAC cell lines relative to control pancreatic cells (HPNE). B, IHC images of CD73+ KPC tumor. C, Western blot image and quantification of CD73 levels in Hec1-8 cell lines and lysates from KPC subcutaneous tumors, KCAcinar and KCDuct pancreata. D, HPLC analysis of the adenosine:AMP ratio from ex vivo–cultured KCDuct and KCAcinar pancreata at the time of euthanasia (n = 3 mice per group). Adenosine:AMP ratios are elevated in cultured KCDuct pancreata compared with KCAcinar pancreata (P = 0.09). E, HPLC analysis of adenosine and AMP levels in WT pancreas, KCDuct, or KCAcinar. N = 3 samples per group. Intrapancreatic adenosine levels are significantly elevated in KCDuct pancreata, consistent with high CD73 expression in KCDuct neoplasia and intrapancreatic AMP levels are highest in WT and KCAcinar tissue, indicating lack of CD73 activity in these tissues. F, Representative CD73 IHC showing high percentage expression of CD73 in ductal-derived PDAC from both KPCDuct and KCDuct when compared with acinar-derived PDAC from KPCAcinar and KCAcinar. G, ImageJ quantification of CD73 expression in the epithelium compared with stroma in ductal-derived compared with acinar-derived PDAC (n = 5). H and I, Representative composite multiplex immunofluorescent image from a KPC subQ tumor (H) and KCDuct and KCAcinar pancreata (I). J, Quantitative assessment of KPC subQ tumor, KCDuct and KCAcinar pancreata using multiplex immunofluorescence. In all groups, activated CD8+ T cells have the highest fluorescence intensity compared with CD8+ T cells, epithelial cells, and macrophages. The overall percentage of CD73 cells was the highest in KPC and KCDuct samples compared. Scale bars, 50 μm. A Student t test was used for statistical comparison. *, P < 0.05; **, P < 0.01; ***, P < 0.001; ****, P < 0.0001; ns, nonsignificant.