
Fig. 2.
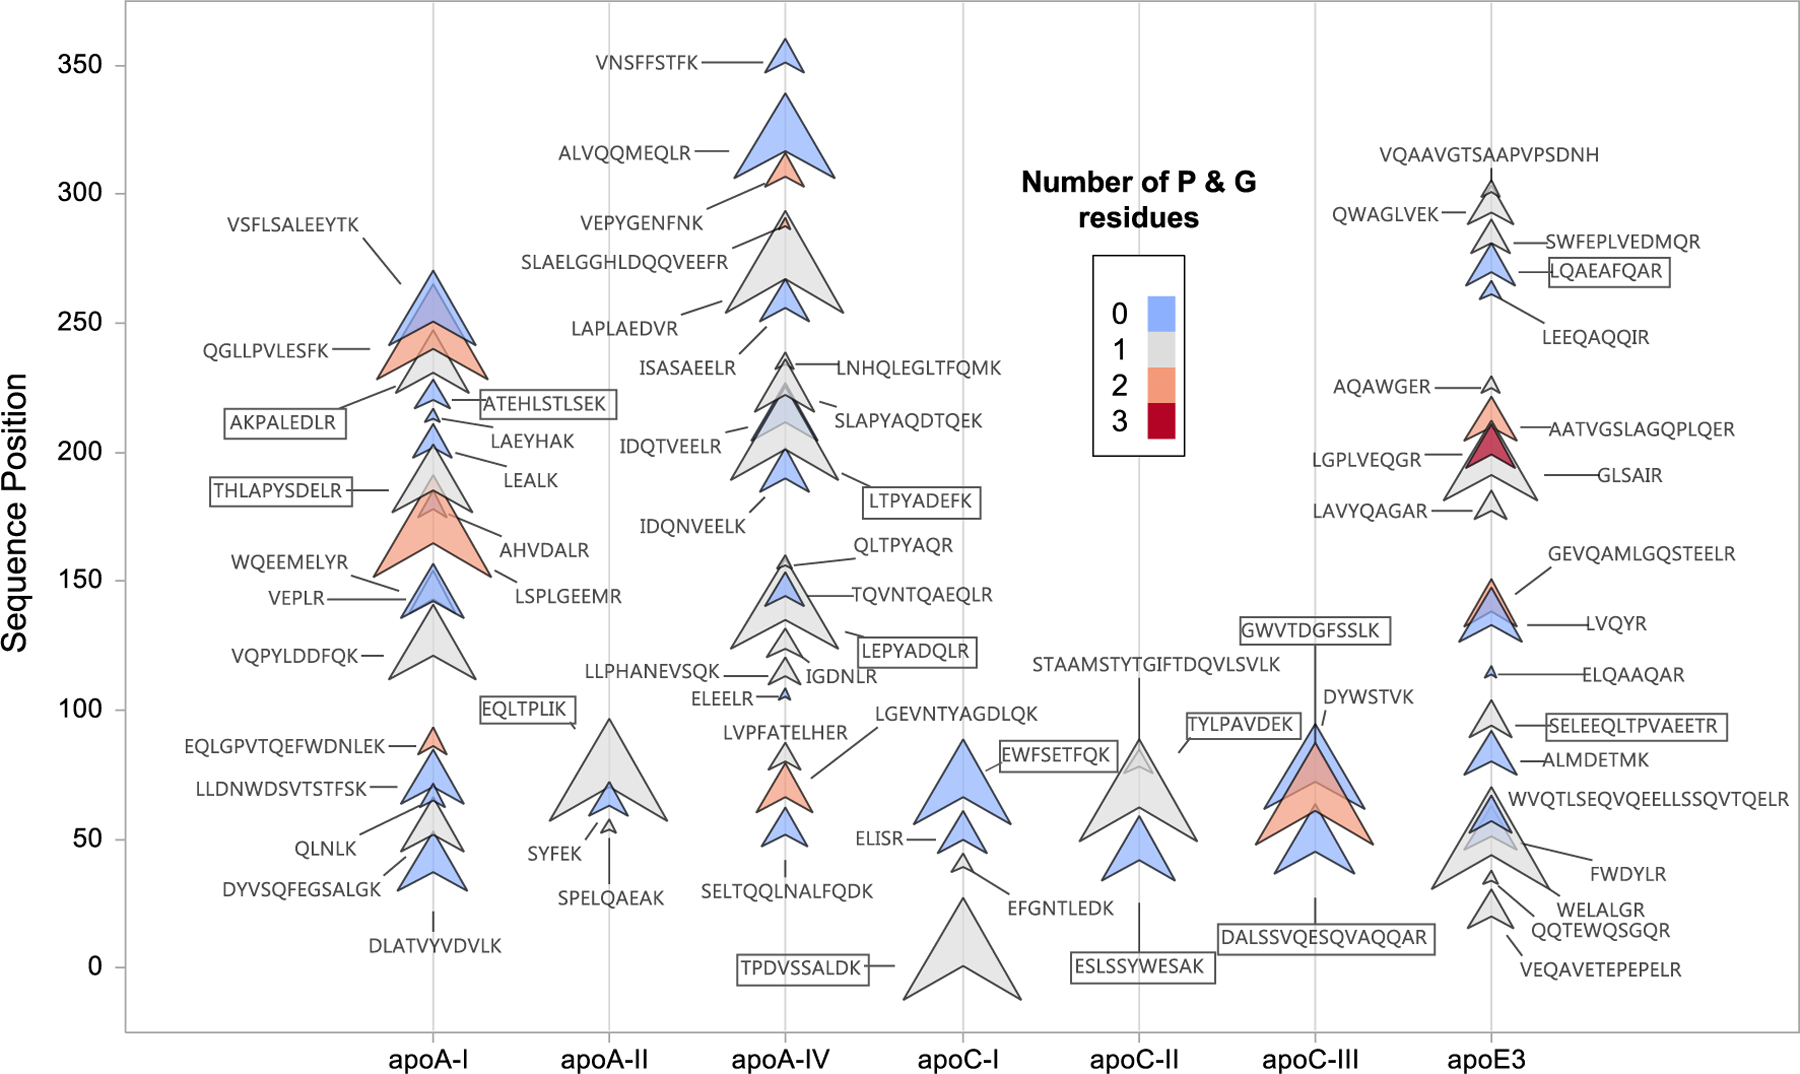
Trypsin releasable peptides of apolipoproteins A-I, A-II, A-IV, C-I, C-II, C-III and E. The size of the markers reflect LC-MS/MS signal area vs. concentration regression slopes. The markers are colored by number of loop inducing (P + G) residues.