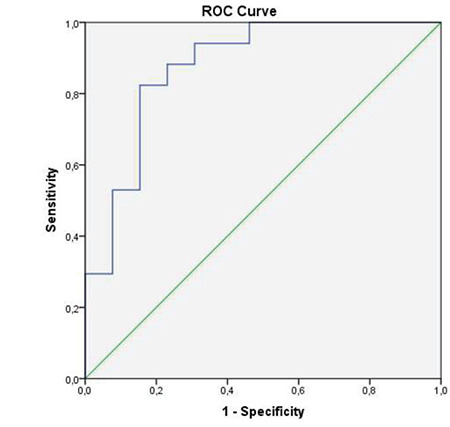
Figure 1.

Receiver operating characteristic (ROC) curve for the prediction of pathological complete response (pCR) using ΔSUVmax in F-18 FDG PET/CT [Area under ROC curve (AUC)=0.878]
FDG: fluorodeoxyglucose; PET: positron emission tomography; CT: computerized tomography
