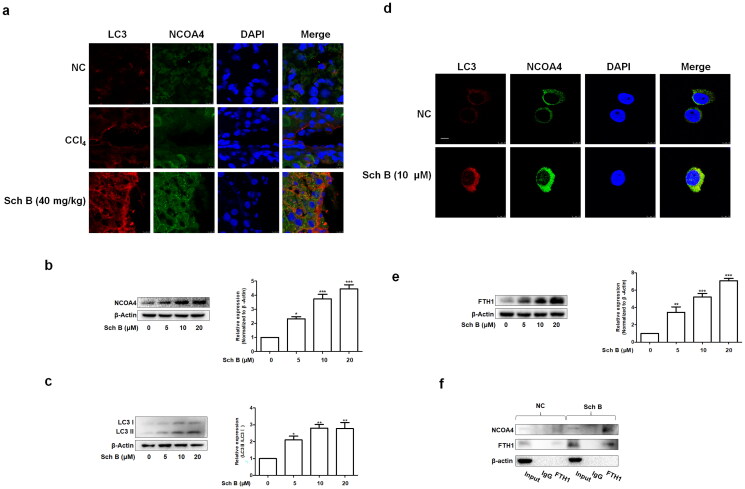
Figure 4.
Sch B regulates NCOA4-mediated ferritinophagy in activated HSCs. (a) Immunofluorescence staining analysis of the localization of NCOA4 and LC3B in liver tissue. Nuclear was shown by DAPI. Scale bar, 10 μm (n = 3). (b, c) Western blot analyses of NCOA4 and LC3B in LX2 cells (n = 3). Data were expressed as mean ± SD. Significance: *P < 0.05, **P < 0.01, ***P < 0.001 vs. Control. (d) Immunofluorescence staining analysis of the localization of NCOA4 and LC3B in LX2 cells. Nuclear was shown by DAPI. Scale bar, 7.5 μm (n = 3). (e) Western blot analyses of FTH1 in LX2 cells (n = 3). Data were expressed as mean ± SD. Significance: **P < 0.01, ***P < 0.001 vs. Control. (f) Co-IP analysis of the interaction between FTH1 and NCOA4.

